
FIG. 4.
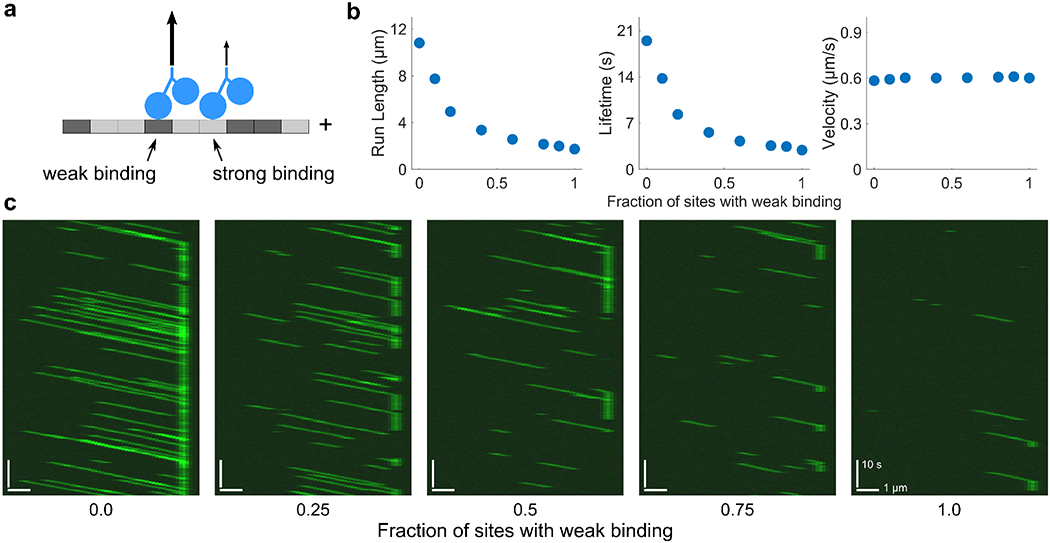
Effects of modeling heterogeneous tubulin with a mix of strong-and weak-binding sites. (a) Model schematic. A fraction of tubulin sites (dark grey) are weakly binding. (b) Plots of motor run length, lifetime, and velocity as a function of the fraction of sites with weak binding. Here, and c = 50 pM. Motor processivity has been increased by an order of magnitude from the reference parameter set. Data points are the average of five independent runs. Error bars correspond to the standard error of the mean and are typically smaller than the points. (c) Simulated kymographs with varying fraction of weak-binding tubulin with all motors fluorescently labeled. Here c = 150 pM.