Figure 1.

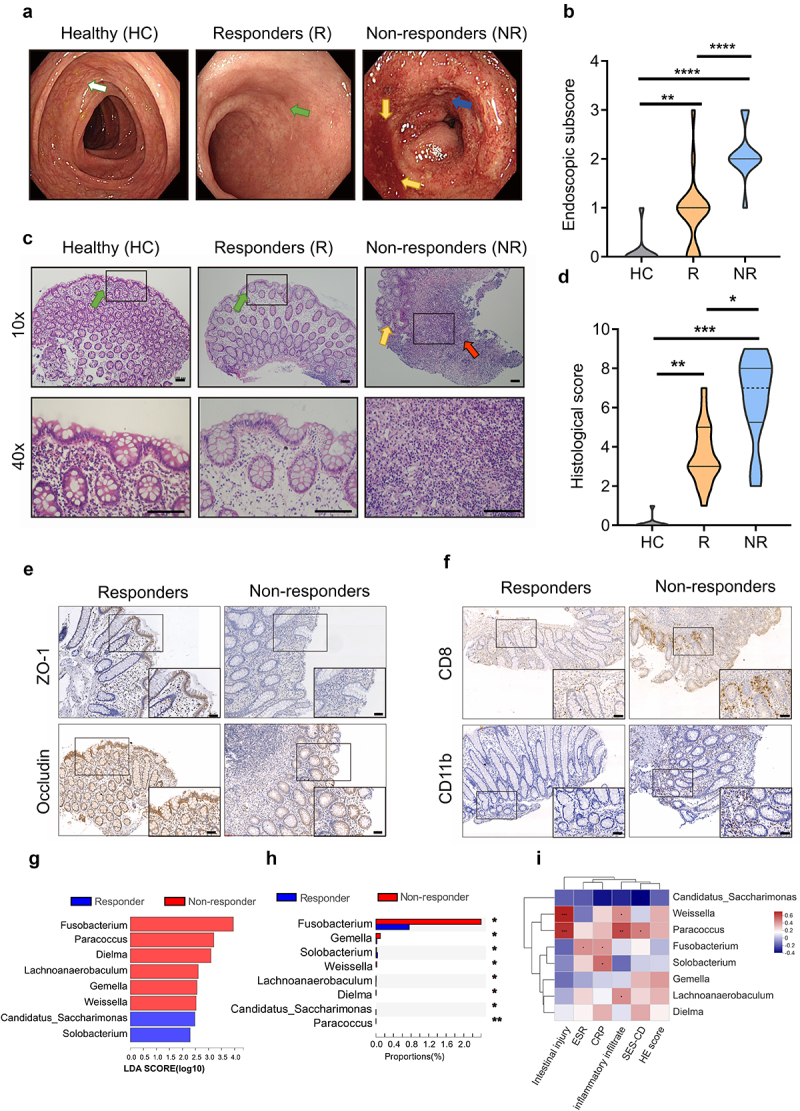
Gut dysbacteriosis is correlated with the compromised effects of anti-TNF-α therapy in IBD patients.
Note: (a) Representative endoscopic images of healthy controls (HC), anti-TNF-α therapy (Infliximab, IFX) responders (R) and non-responders (NR) with IBD. White arrow shows intact intestinal mucosa with clear blood vessels. Green arrow shows the repairment of damaged intestinal mucosa while yellow arrows show extensive mucosal erosion with bleeding. Blue arrow indicates endoscopic ulcers.
(b) Endoscopic subscore for evaluating mucosal appearance of healthy controls (HC), anti-TNF-α therapy responders (R) and non-responders (NR) with IBD.
(c) Representative images of the Hematoxylin and eosin (H&E)-stained colon biopsy sections of healthy controls (HC), anti-TNF-α therapy responders (R) and non-responders (NR) with IBD. Top: 10×, scale bar = 100 μm; Bottom: 40×, scale bar = 100 μm. The black-boxed areas at the top are enlarged in bottom right corner. Green arrow indicates dense and tightly connected intestinal epithelial cells, and yellow arrow shows extensive damage and loss of mucosal epithelial layer. Red arrow marks lesions and infiltration of inflammatory cells.
(d) Histological score for loss of epithelium, crypt damage, depletion of goblet cells and infiltration of inflammatory cells in healthy controls (HC), anti-TNF-α therapy responders (R) and non-responders (NR) with IBD.
(e) Immunohistochemical images of colon sections stained for epithelial marker including ZO-1 and Occludin in anti-TNF-α therapy responders (R) and non-responders (NR) with IBD. A high-magnification of the region is shown (bottom right). Scale bar = 50 μm.
(f) Immunohistochemical images of colon sections stained for CD8+ and CD11b+ cells in colonic lamina propria in anti-TNF-α therapy responders (R) and non-responders (NR) with IBD. A high-magnification of the region is shown (bottom right). Scale bar = 50 μm
(g) Differences in microbial taxa at genus level between anti-TNF-α therapy responders (R) and non-responders (NR) with IBD were calculated by LDA effect size (LEfSe). (P < 0.01 and LDA score>2.0). Higher abundant genera in NR are shaded with red and higher abundant genera in R are shaded with blue.
(h) Proportions of different microbial genus in feces between anti-TNF-α therapy responders (R) and non-responders (NR) with IBD. Significance was tested using Wilcoxon rank-sum test with FDR multiple test correction.
(i) Pearson correlation analysis shows the association between differential microbial abundance and clinical features.
Data represent means ± SEM (HC = 10, R = 19, NR = 12); *P < 0.05; ** P < 0.01; *** P < 0.001; **** P < 0.0001; NS, no statistical significance. P values were calculated by Kruskal-Wallis test [(b) and (d)], Wilcoxon rank-sum test (h) and Pearson correlation analysis (i).
