Figure 5.

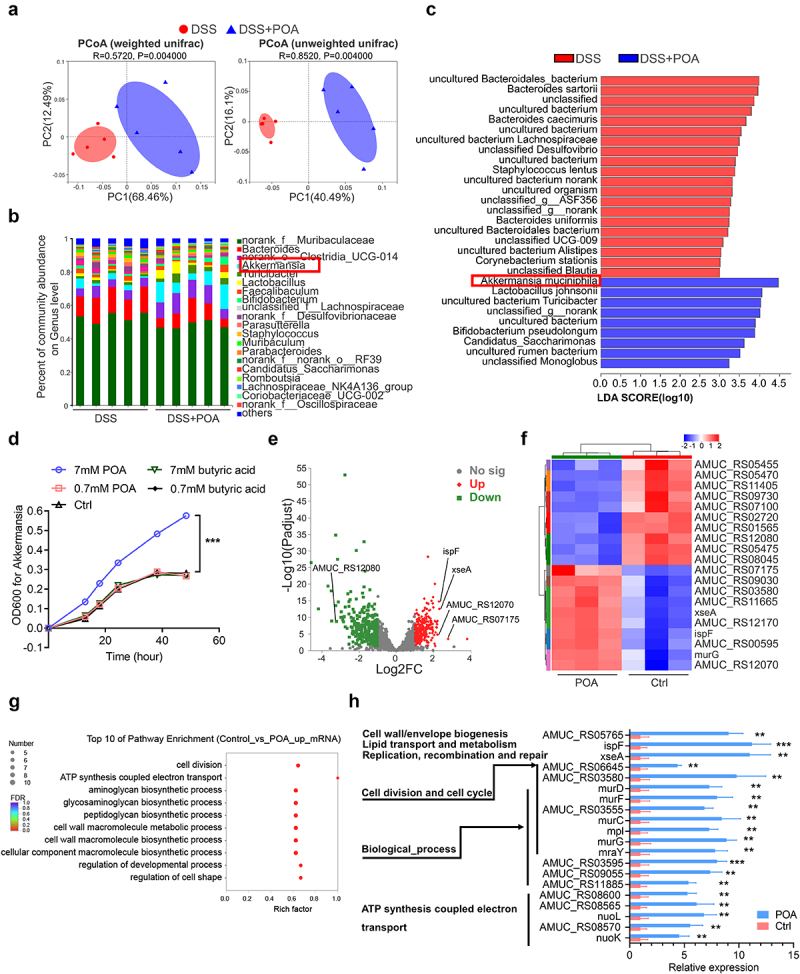
Palmitoleic acid (POA) reprograms gut microbiota compositions, enhances the growth of Akkermansia muciniphila via upregulating transcription signatures of cell division and biosynthetic process, increases the intestinal abundance of Akkermansia muciniphila.
Note: (a) Principal coordinate analysis (PCoA) plots on OUT level were based on weighted and unweighted unifrac. Red points indicated the microbiota enriched in DSS-treated mice and blue points indicated the microbiota enriched in DSS-treated mice receiving palmitoleic acid (POA) [analysis of similarities (ANOSIM): R = 0.5720, P = 0.004 and R = 0.8520, P = 0.004 with 999 permutations].
(b) The relative abundance of bacteria on genus level of DSS-treated mice receiving water or palmitoleic acid (POA).
(c) Linear discriminant analysis (LDA) coupled with effect size measurements (LEfSe) identified the species with different abundance of DSS-treated mice receiving water or palmitoleic acid (POA). Higher abundant species in DSS-treated mice are shaded with red and higher abundant species in DSS-treated mice receiving palmitoleic acid (POA) are shaded with blue (P < 0.05 and LDA score>3.0). qPCR validation of the relative abundance of different microbial taxa was shown in Supplementary Figure 14.
(d) The growth curve of Akkermansia muciniphila cultured with 7 mM palmitoleic acid (POA), 0.7 mM palmitoleic acid (POA), vehicle control (Ctrl), 7 mM butyric acid or 0.7 mM butyric acid, in an anaerobic cabinet in BHI broth supplemented with 0.25% mucin. The growth curve of other bacteria was shown in Supplementary Figure 15.
(e) Volcano plot of differential expressed genes (DEGs) in Akkermansia muciniphila in response to 7 mM palmitoleic acid (POA). Red spots represent upregulated genes, and green spots represent downregulated genes (FC ≥ 2 and p-adjust≤0.05). Each group contains data for three independent samples.
(f)Fold changes of the expression of top 10 upregulated or downregulated genes response to 7 mM palmitoleic acid (POA) compared with control in Akkermansia muciniphila.
(g) GO enrichment analysis of upregulated DEGs in Akkermansia muciniphila in response to 7 mM palmitoleic acid (POA). The plot showed top 10 functional classifications of GO categories including cellular component, biological process, and molecular function. GO enrichment analysis of downregulated DEGs in Akkermansia muciniphila in response to 7 mM palmitoleic acid (POA) was shown in Supplementary Figure 16.
(h) The expression levels of upregulated DEGs related to functional classifications of GO categories in Akkermansia muciniphila in response to 7 mM palmitoleic acid (POA).
Data represent mean± SEM (n = 5 mice per group); **P < 0.01; ***P < 0.001; NS, no statistical significance. P values were calculated by two-tailed unpaired Student’s t test [(d) and (h)].
