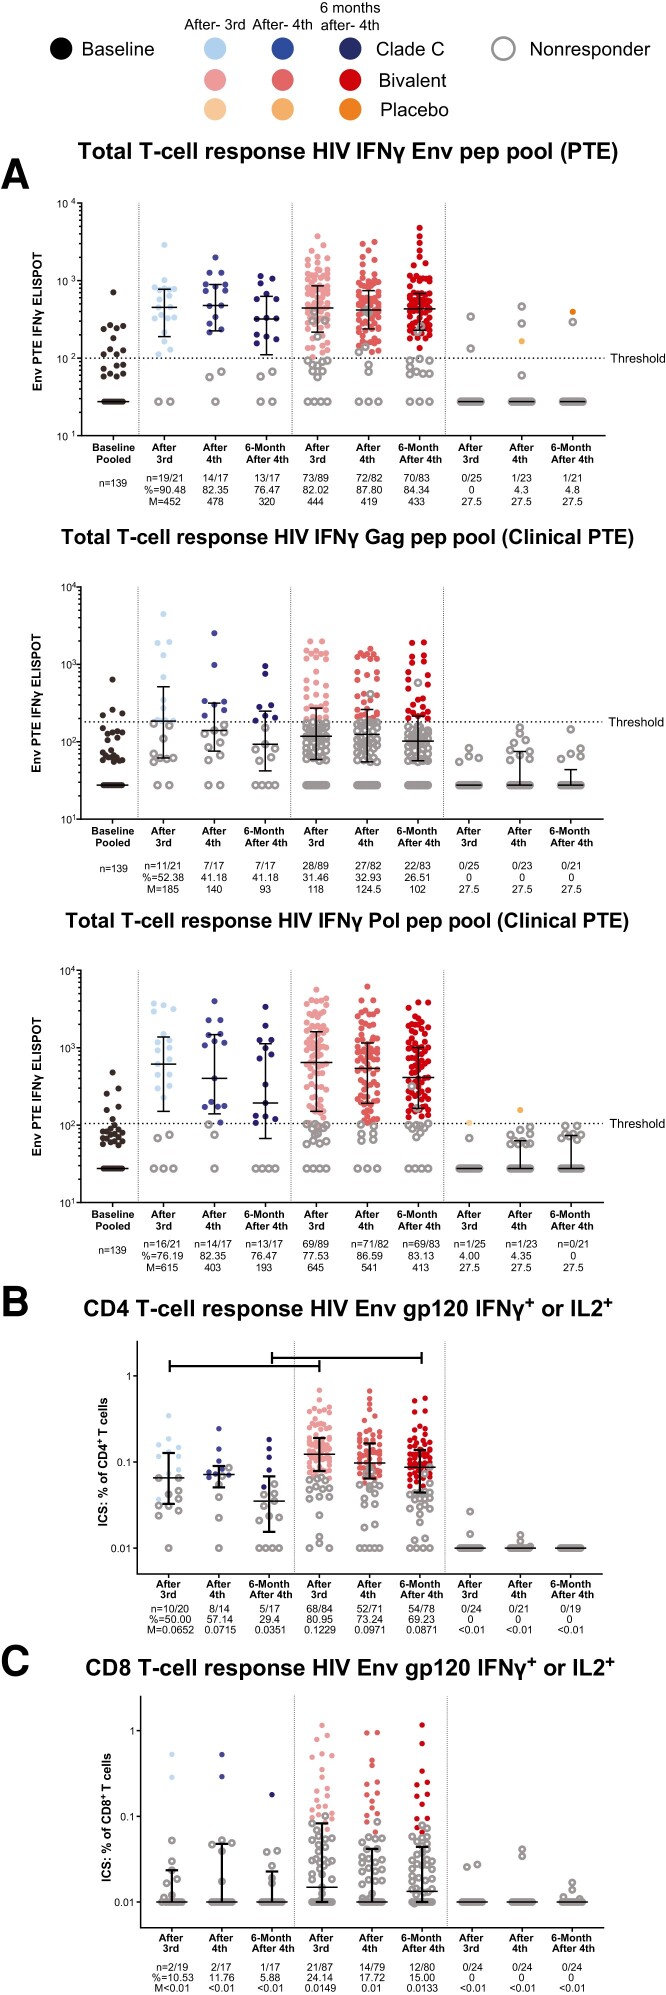
Figure 4.
Cellular immune responses. IFN-γ ELISPOT response to stimulation with PTE pools of HIV-1 Env, Gag, and Pol immunogens (A), and ICS to detect IFN-γ– and/or IL-2–producing CD4+ (B) and CD8+ T cells (C) in response to HIV-1 Env gp120 vaccine-matched mosaic immunogens. The analysis was performed using the data from the per-protocol immunogenicity set. ELISPOT responders were defined as a 3-fold increase from baseline for participants with baseline values greater than the threshold, or a postvaccination result greater than threshold for participants with baseline values less than the threshold. ICS responders were defined by Fisher exact test comparison between stimulated and unstimulated cells with resultant P < 1 × 10⁻⁵. Dots represent the data from each participant, open circles represent nonresponders, closed circles represent vaccine responders. Median and interquartile range (bars) of the magnitude are presented for each group at each time point. Horizontal bar at the top represents significant difference in Wilcoxon rank sum test at P < .05. Abbreviations: ELISPOT, enzyme-linked immunosorbent spot; Env, envelope; Gag, group-specific antigen; HIV, human immunodeficiency virus; ICS, intracellular cytokine staining; IFN-γ, interferon γ; IL, interleukin; M, median; pep, peptide; Pol, polymerase; PTE, potential T-cell epitope.

