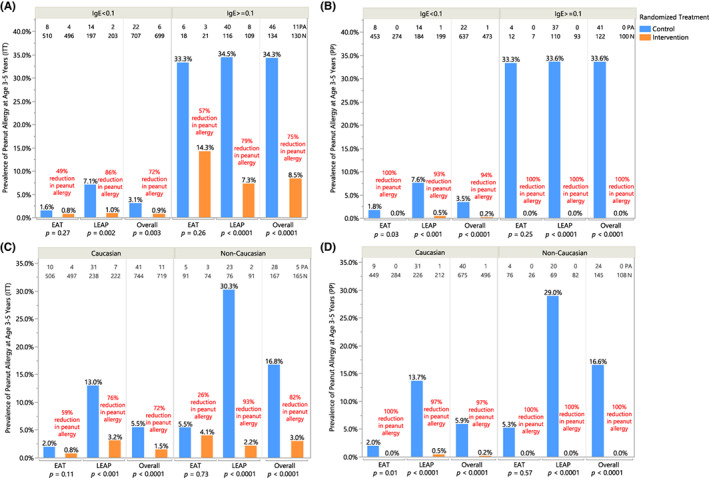
FIGURE 3.

Peanut allergy prevalence by specific IgE sensitization status at enrollment—(A) intention‐to‐treat and (B) per‐protocol population; in Caucasian and non‐Caucasian children—(C) intention‐to treat and (D) per‐protocol population. Prevalence of peanut allergy in each randomized treatment group is shown in baseline sensitized (peanut‐specific IgE >= 0.1 kU/L) and unsensitized (peanut‐specific IgE <0.1 kU/L) subgroups for individual and combined studies in (A) ITT analysis and (B) PP analysis; in Caucasian and non‐Caucasian subgroups within individual and combined studies in (C) ITT analysis and (D) PP analysis. Number of peanut allergy (PA) and total number of participants (N) are annotated at the top. Each bar is annotated with the prevalence of peanut allergy as determined by OFC at 3 years (EAT) or 5 years of age (LEAP); relative risk reduction in individual and combined studies is annotated in red. Pearson's chi‐squared was used to determine annotated p‐values; when expected values were less than 5, Fisher's two‐tailed exact test was used. Fisher's p‐value is reported for the ITT analysis among sensitized participants in the EAT study, PP analysis in both sensitized and unsensitized subgroups in the EAT study, ITT analysis among non‐Caucasian participants in the EAT study, and PP analysis in both Caucasian and non‐Caucasian subgroups in the EAT study.
