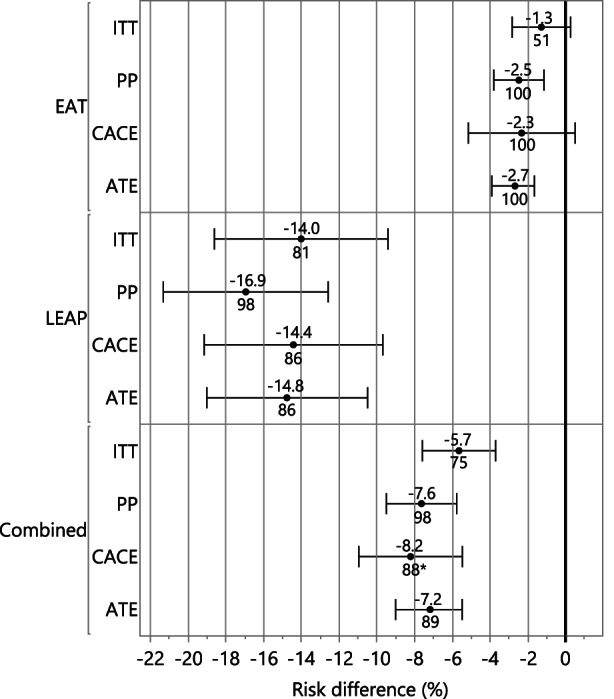
FIGURE 4.

Forest plot of peanut allergy prevention effect sizes among the different study populations and analysis methods. This forest plot shows the percentage relative risk reductions in peanut allergy annotated below the marker and risk differences (x‐axis) in peanut allergy are annotated above the marker among the different cohorts (EAT, LEAP and combined studies). Relative risk reductions and risk differences are relative to the control (peanut avoidance) group and determined by intention‐to‐treat (ITT), per‐protocol (PP) and causal inference methods: complier average causal effect (CACE) and average treatment effect (ATE). Additionally, average treatment effect for the treated (ATT) and average treatment effect for the untreated (ATU) are shown in Figure S3. *Not adjusted for study; two‐staged least squares regression produces a risk difference estimate only; relative risks were computed by determining a theoretical peanut allergy rate among control participants, under the assumption of the CACE model that participants of the control group have the same probability of being non‐compliant as participants of the intervention group and being offered the intervention has no effect on the outcome. Thus, the combined relative risk under the CACE approach does not adjust for study.
