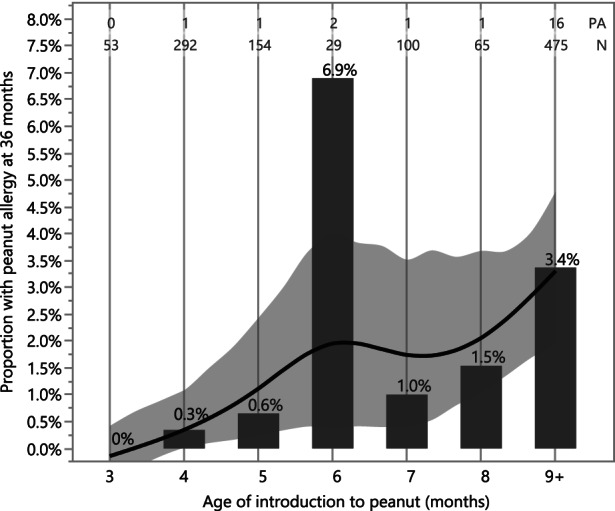
FIGURE 5.

Prevalence of peanut allergy by age of introduction to peanut in the EAT study. The prevalence of peanut allergy at 36 months is shown according to the month of peanut introduction in the EAT cohort with available data (n = 1168) irrespective of randomization group. Those starting to consume peanut at 9 months of age or older or who never introduced peanut were grouped into a single 9+ category. The smoothed regression line and bootstrapped confidence intervals are created with a cubic spline to visualize the prevalence of peanut allergy conditional on when peanut was introduced into the diet. The adherent EAT participants randomized to the early introduction group (EIG) are shown in the 3–5 months bins whereas the non‐adherent participants are dispersed along with the standard introduction participants in the 6 to 9+ bins. The number of subjects with peanut allergy (PA), the total sample size (N) and the proportion (%) with peanut allergy are annotated above each bar. The large risk of peanut allergy apparent in the 6‐months category may be an artefact of the study design where participants were asked to consume before the 6‐months time point resulting in an artificially low sample size.
