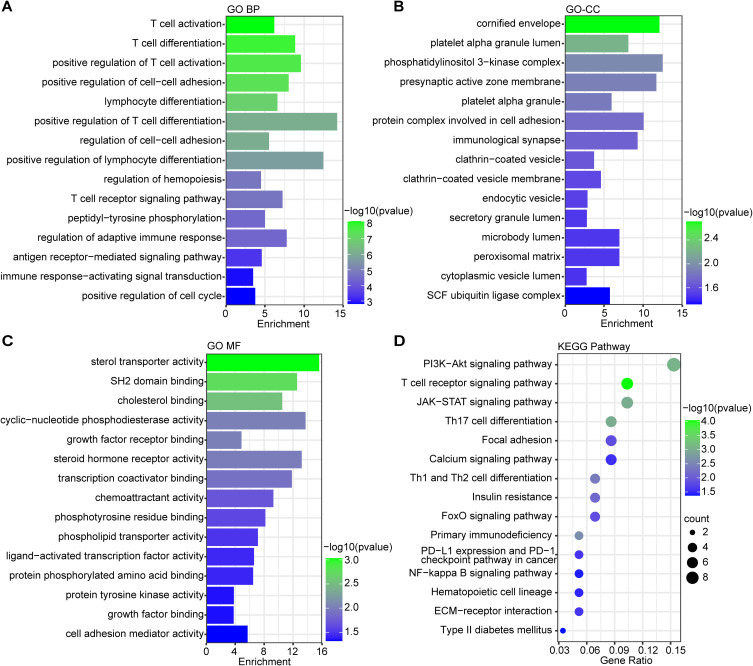
Figure 3.
The enrichment analysis of common DEGs between PS and MDD. A-C. The GO enrichment analyses of common DEGs with P-value based on the KOBAS 3.0 database. Top 15 BP terms (A), Top 15 CC terms (B) and Top 15 MF terms (C) were shown. (D) The KEGG pathway enrichment analysis of communal DEGs on the ground of KOBAS 3.0 database. The size of the circle represents the number of genes involved, and the abscissa represents the frequency of the genes involved in the term total genes. P-value < 0.05 was considered significant.

