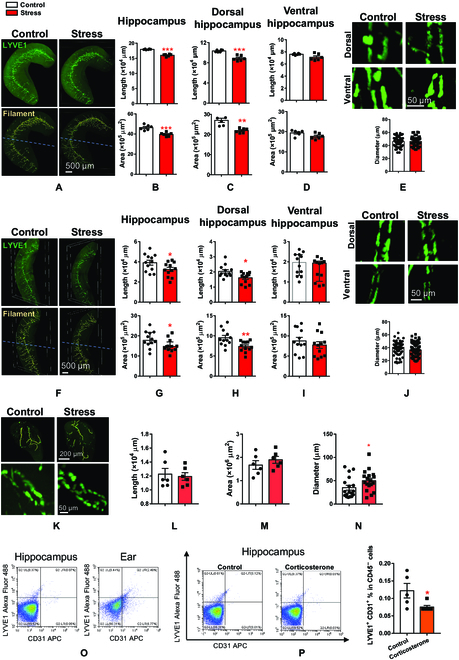
Fig. 3.

Chronic stress down-regulates deep brain lymphatic vessels. (A) Representative 3D fluorescent images of hippocampal lymphatic vessels (top) and IMARIS processed images by using Filament and Surface algorithm (bottom) taken from brains of Control and Stress groups by using iDISCO+ and light-sheet imaging in whole brain. (B to D) Quantitative analysis of lymphatic vessels length (top) and area (bottom) in whole hippocampus (B), dorsal (C), and ventral (D) parts of the hippocampus. (E) Top: Representative fluorescent images of lymphatic vessels in dorsal and ventral hippocampus of Control and Stress mice. Bottom: Quantitative analysis of lymphatic vessel diameter in the hippocampus. Data were obtained by using iDISCO+ and light-sheet imaging in whole brain. (F to J) Same as (A) to (E) but using CLARITY and confocal imaging in thick brain sections. (K) Top: Representative 3D fluorescent images of IMARIS processed images of amygdala from brains of Control and Stress groups by using iDISCO+ and light-sheet imaging in whole brain. Bottom: Representative fluorescent images of lymphatic vessels in amygdala of Control and Stress mice. (L to N) Quantitative analysis of lymphatic vessels length (L), area (M), and diameter (N) in amygdala. (O) Representative dot plots for lymphatic endothelial cells identified by CD31+ (endothelial cell marker) and LYVE1+ (lymphatic vessels marker) in the hippocampus and ear (used as positive control tissue) of adult mice. (P) Left: Representative dot plots for lymphatic endothelial cells identified by CD31+ and LYVE1+ in the hippocampus of Control or Corticosterone-treated mice. Right: Quantitative analysis of the percentage of lymphatic endothelial cells identified by CD31+ and LYVE1+ in the hippocampus of Control or Corticosterone-treated mice. Data are presented as mean ± SEM. *P < 0.05, **P < 0.01, ***P < 0.001. For detailed statistical analysis, see Tables S2 to S4.
