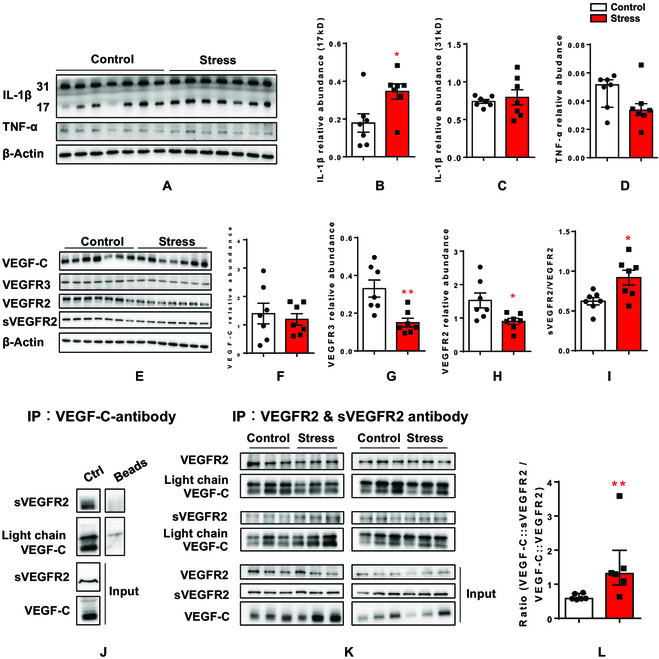
Fig. 4.

Chronic stress down-regulates VEGF-C signaling pathway. (A) Western blot images of IL-1β and TNF-α in Control and Stress groups. The codetection of β-actin bands served as loading control. (B to D) Quantitative analysis of the 17-kD IL-1β (B), 31-kD IL-1β (C), and TNF-α (D). All data were normalized to the corresponding band of the loading control β-actin. (E) Western blot images of VEGF-C, VEGFR2, and VEGFR3 as well as the cleaved and soluble VEGFR2 (sVEGFR2) in Control and Stress groups. The codetection of β-actin bands served as loading control. (F to I) Quantitative analysis of VEGF-C (F), VEGFR3 (G), VEGFR2 (H), and sVEGFR2 (I, presented as sVEGFR2/VEGFR2 ratio). All data were normalized to the corresponding band of the loading control β-actin. (J) Coimmunoprecipitation of VEGF-C and sVEGFR2 in hippocampal lysates by using VEGF-C antibody. (K) Coimmunoprecipitation of VEGF-C and VEGFR2 or sVEGFR2 in hippocampal lysates obtained from Control or Stress mice by using VEGFR2 and sVEGFR2 antibodies. (L) Quantitative analysis of the fractions of VEGF-C that binds to sVEGR2 as a ratio to that binding to VEGFR2 in Control and Stress groups. Data are presented as means ± SEM. *P < 0.05, **P < 0.01. For detailed statistical analysis, see Tables S2 to S4.
