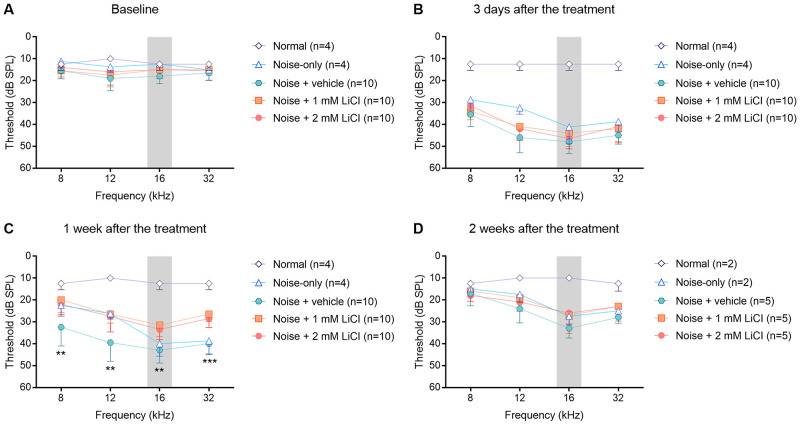
Fig 2. Mean plots of ABR thresholds measured at baseline (A), 3 days (B), one week (C), and two weeks (D) after the treatment.
Noise-induced threshold shifts one week after exposure differed significantly among the experimental groups (noise + vehicle, noise + 1 mM LiCl, and noise + 2 mM LiCl). The gray shaded area indicates narrow-band noise spectrum. Error bars show standard deviation. The statistical significance of group differences is indicated by asterisks: * p < 0.05, ** p < 0.01, *** p < 0.001 based on the Kruskal-Wallis H test. n = number of animals, ABR; auditory brainstem response, dB SPL; decibel sound pressure level.

