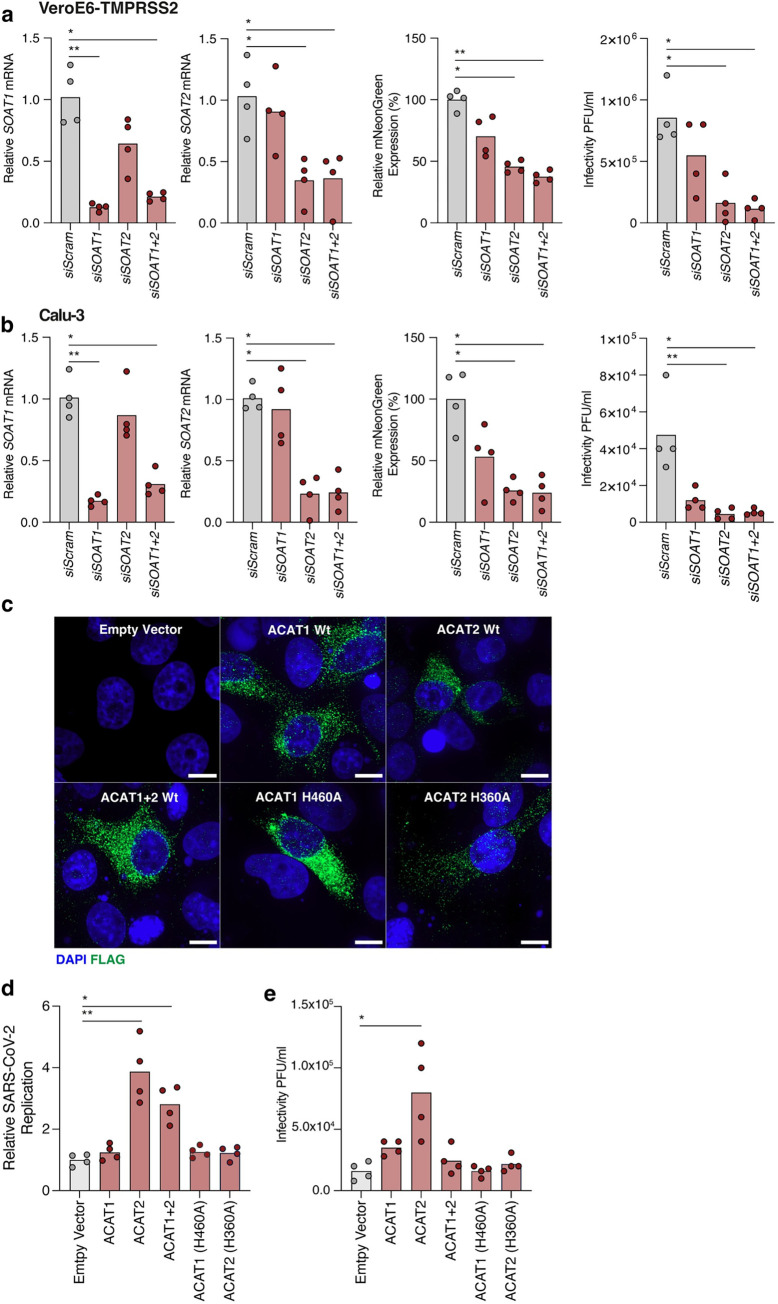
Fig 5. siRNA knockdown and overexpression of ACAT modulates SARS-CoV-2.
(a) VeroE6-TMPRSS2 and Calu-3 (b) cells were transfected with siRNAs targeting SOAT1 or SOAT2, respectively. Cells were infected with an infectious fluorescent SARS-CoV-2 reporter virus encoding mNeonGreen at an MOI of 0.01 and SOAT1 and SOAT2 mRNA levels quantified by qPCR. mNeon-Green fluorescence was measured 24h post-infection and data plotted relative to the siRNA scramble control. Infectious virus from siRNA transfected cultures was assessed by plaque assay. Data is representative of n = 4 biological replicates. (c) Immunofluorescent imaging of VeroE6-TMPRSS2 cells transfected with FLAG-tagged ACAT1 and ACAT2 wild-type (Wt) or catalytically inactive mutants and stained with anti-FLAG. Images were taken at x192 magnification and scale bars represent 10μm. (d) VeroE6-TMPRSS2 cells, transfected with ACAT expression plasmids were infected with SARS-CoV-2_mNeonGreen at an MOI of 0.01 and fluorescence measured at 24h post infection. (e) Quantification of infectious virus secreted from cells in (d) by plaque assay. Data are representative of n = 4 biological replicates and statistical significance determined by Kruskal-Wallis.

