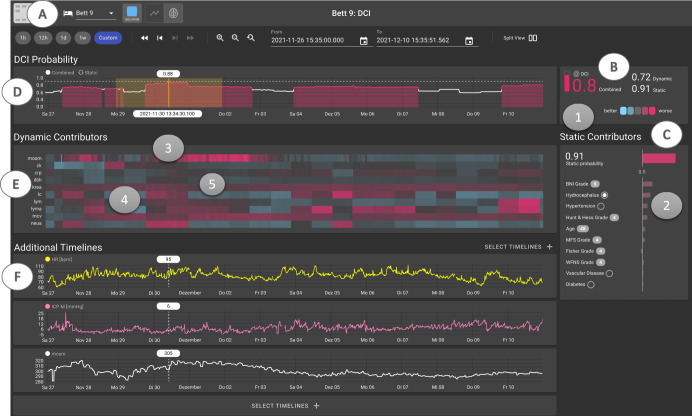
Fig. 2. Screenshot of the DCIP system user interface prototype.
The DCIP user interface aims to facilitate clinicians’ understanding of the ML model’s predictions with minimal time and effort. The header menu (A) displays information about the selected patient. In the overview frame (B), the current combined DCI risk score (0.8) is displayed, based on dynamic (0.72) and static (0.91) contributors (pink vs. blue hues indicating higher vs. lower risk). The static contributor view (C) displays Shapley values of static contributors assessed at the time of patient admission, including reference values for cohort-level evidence based on clinical norms such as the Barrow Neurological Institute Grading Scale (BNI), Hunt & Hess Grade, Modified Fisher Grade (MFS), Fisher Grade, and World Federation of Neurological Surgeons Grade (WFNS). The horizontal bar chart displays how the values below/above 0.5 decrease or increase the DCI risk score (in order of importance) The DCI probability frame (D) displays periods of high risk for DCI as colored areas under the curve, allowing clinicians to probe exact numeric values at each point in time. The solid line represents the combined risk fluctuating over time and the dashed line indicates the constant static probability (0.9). The Dynamic Contributors frame (E) displays a heatmap of Shapley values of dynamic contributors over time. Each heatmap lane shows how much a given signal (e.g., mOsm = Serum osmolality) contributes to the DCI risk at a given point in time (hover) and can be added (double-click) as an additional timeline displaying raw values below (F). Additional timelines can be added on demand to provide context for feature-level explanations (e.g., Heart Rate [bpm], intracranial pressure [mmHg], pupil reaction time). All timelines are in synch and can be zoomed/panned as desired. Individual points in time can be probed to reveal exact numeric values across all charts. For context information outside of the DCIP, clinicians can access the target patient’s complete health records (via the separate Electronic Health Record [EHR] system). Numbers 1–5 highlight the specific features referred to by interviewees when searching for model explanations (see Interview results).

