
Fig. 4.
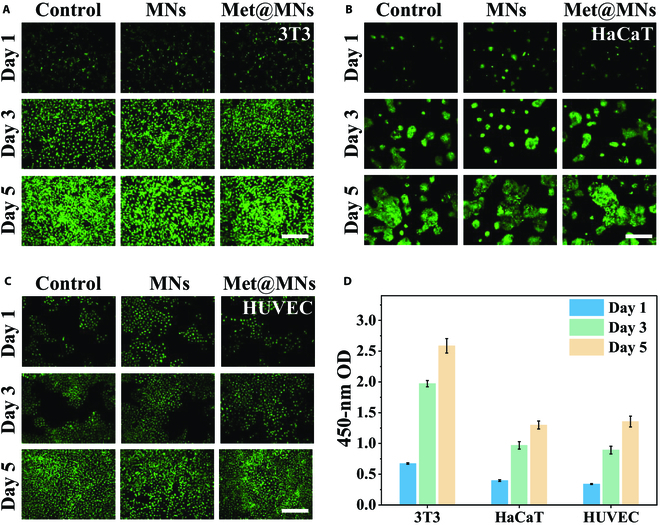
Biocompatibility of MNs. (A to C) The fluorescence images of (A) 3T3, (B) HaCaT, and (C) HUVECs incubated with MNs for different times. (D) The CCK-8 test of cell lines with MNs for different times. Scale bars: 100 μm. OD, optical density.
Official websites use .gov
A
.gov website belongs to an official
government organization in the United States.
Secure .gov websites use HTTPS
A lock (
) or https:// means you've safely
connected to the .gov website. Share sensitive
information only on official, secure websites.
Biocompatibility of MNs. (A to C) The fluorescence images of (A) 3T3, (B) HaCaT, and (C) HUVECs incubated with MNs for different times. (D) The CCK-8 test of cell lines with MNs for different times. Scale bars: 100 μm. OD, optical density.