
Fig. 1.
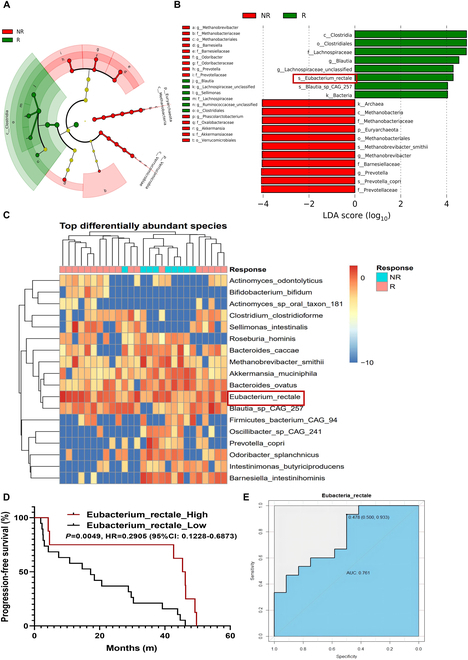
Abundance of E. rectale predicts patient responsiveness to anti-PD1 therapy. (A and B) Results of LEfSe analysis for the R and NR groups. (A) Taxonomic cladogram from LEfSe showed different taxa enriched in the R and NR group (LDA ≥ 4; P < 0.05). (B) LEfSe identified significantly differentially abundant taxa in the R and NR groups (LDA ≥ 4; P < 0.05). (C) Heatmap of relative abundance differences between the R and NR groups at the species level (Wilcoxon test). (D) The Kaplan–Meier method with log-rank test estimates the mPFS for patients with higher or lower abundance of E. rectale. (E) A prediction model was constructed by E. rectale in the training set, and predictive performance on the testing set was evaluated by ROC curves. R (n = 14), NR (n = 11). Multiple experimental data were counted and are presented according to the statistical method, and an asterisk (*) indicates the P value.