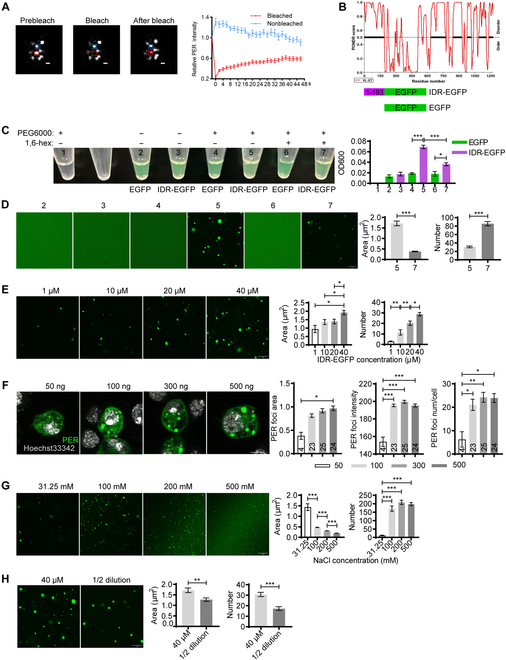
Fig. 1.

PER IDR forms phase-separated condensates. (A) Left panel: Representative confocal images of the PER foci FRAP assay in S2 cells transfected with pAc-per-EGFP-V5-HisB for 36 h. Red and blue rectangles represent bleached foci and control, respectively. Scale bar, 1 μm. Right panel: Quantifications of fluorescence intensity. n = 15 cells. (B) Top panel: Disordered region analysis of PER protein using PONDR. Black with bold lines indicate that disordered sequences. Bottom panel: Schematics of recombinant protein. (C) Left panel: Representative image demonstrating the turbidity of 40 μM solution of indicated contents with or without 10% PEG6000 and 10% 1,6-hexanediol (simplified as 1,6-hex). Each solution is given a number as an indicator. Right panel: Plot shows mean optical density 600 (OD600) of the solutions. n = 3. (D) Left panel: Representative confocal images of protein solutions in (B). Right panel: Quantification of the area and number of IDR-EGFP droplets in the presence PEG6000 or PEG6000 and 1,6-hexanediol. n ≥ 10 fields of view from 3 repeats. Scale bar, 10 μm. (E) Left panel: Representative confocal images of IDR-EGFP droplets at different protein concentrations. IDR-EGFP was diluted with buffer to indicated concentrations. Right panel: Quantification of the area and number of droplets. n ≥ 10 fields of view from 3 repeats. Scale bar, 10 μm. (F) Left panel: Representative confocal images of S2 cells transfected with indicated dosage of pAc-per-V5-HisB for 36 h and immunostained with Hoechst 33342 (gray) and anti-PER (green). Right panel: Quantification of PER foci area, intensity, and number per cell. n refers to the number of cells and is indicated on the bars. (G) Left panel: Representative confocal images of PER-IDR droplets at different NaCl concentrations. Protein concentration used is 10 μM. Right panel: Quantification of the area and number of droplets. n ≥ 10 fields of view from 3 repeats. Scale bar, 10 μm. (H) Left panel: Representative confocal images of 40 μM PER-IDR droplets and 1/2 dilution. Right panel: Quantification of the area and number of droplets. n ≥ 10 fields of view from 3 repeats. Scale bar, 10 μm. Error bars represent standard error of the mean (SEM). One-way ANOVA, Tukey’s multiple comparison test for (C) and (E) to (G). Student t test for (D) and (H). *P < 0.05, **P < 0.01, ***P < 0.001.
