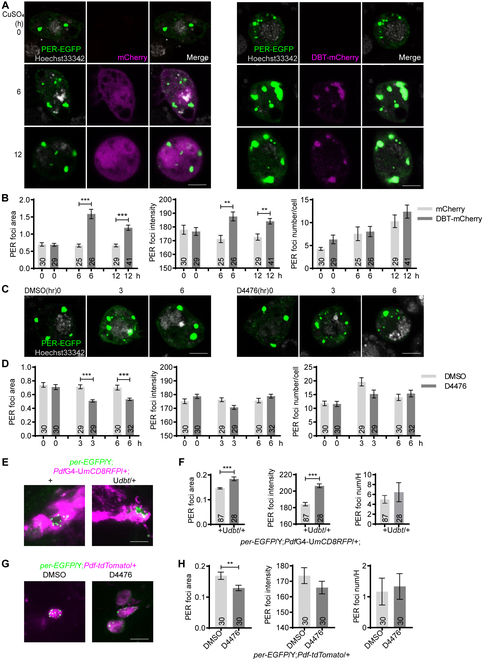
Fig. 3.

DBT increases PER foci size. (A) Representative confocal images of PER foci in S2 cells transfected with 100 ng of pAc-per-EGFP-V5-HisB and pMT-mCherry or pMT-dbt-mCherry for 30 h. Then, 500 μM CuSO4 was added to induce mCherry or dbt-mCherry expression. PER foci were live imaged at indicated time post induction. (B) Quantification of PER foci area, intensity, and number per cell in (A). (C) Representative confocal images of PER foci in S2 cells transfected with 100 ng pAc-per-EGFP-V5-HisB for 36 h and then treated with D4476 (10 μM) for indicated time periods. PER foci were imaged live at indicated time points. (D) Quantification of PER foci area, intensity, and number per cell in (C). (E) Representative confocal images of PER foci in the s-LNvs of per-EGFP/Y;PdfGAL4-UASmCD8RFP/+ flies overexpressing dbt and control flies at CT0 on DD1. Green, PER-EGFP; magenta, mCD8RFP. (F) Quantification of PER foci area, intensity, and number per hemisphere in (E). (G) Representative confocal images of PER foci in the s-LNvs of per-EGFP/Y;Pdf-tdTomato/+ flies dissected at CT0 on DD1. The brains were incubated in PBS solution containing DMSO or 20 μM D4476 for 1 h. Green, PER-EGFP; magenta, tdTOMATO. (H) Quantification of PER foci area, intensity, and number per hemisphere in (G). Scale bar, 5 μm. n refers to the number of cells (B and D) or hemispheres (F and H) and is indicated on the bars. Error bars represent SEM. One-way ANOVA and Tukey’s multiple comparison test was used for (B) and (D). Student t test was used for (F) and (H). *P < 0.01, **P < 0.01, ***P < 0.001.
