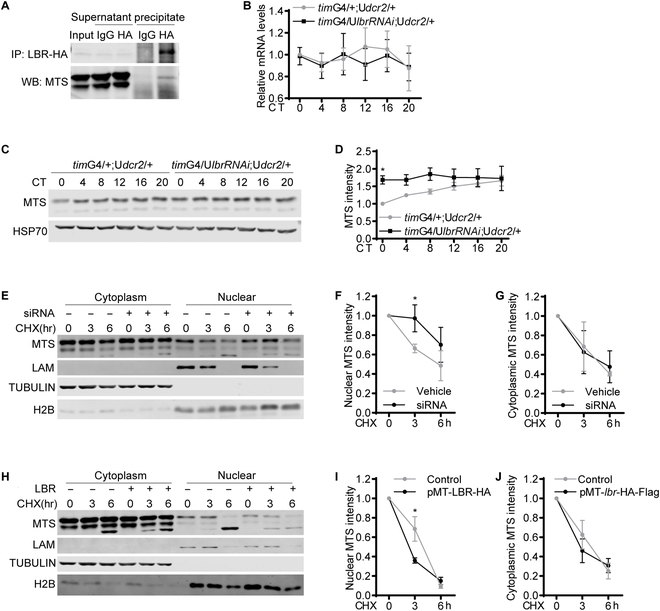
Fig. 4.

LBR binds to and destabilizes MTS. (A) Representative Western blots (WB) of protein extracts prepared from S2 cells transfected with pMT-lbr-Flag-HA and immunoprecipitates as well as supernatants. LBR was immunoprecipitated (IP) with HA antibody, and rabbit IgG was used as control. MTS was detected by Western blotting using MTS antibody. (B) Plot of relative mRNA abundance determined by qRT-PCR for mts from whole-head extracts of timGAL4/+;UASdcr2/+ and timGAL4/UASlbrRNAi;UASdcr2/+ flies collected on the first day of constant darkness (DD1). dcr2 was coexpressed to enhance the efficiency of RNAi. For each time series, the value of control group at CT0 was set to 1. (C) Representative Western blots of protein extracts prepared from whole heads of timG4/+; Udcr2/+ and timG4/UASlbrRNAi;UASdcr2/+ flies collected on DD1. HSP70 was used as a loading control. (D) Quantification of MTS level in (C), which was normalized to that of HSP70. For each group, the value of the control group at CT0 was set to 1. (E) Representative Western blots of cytoplasmic and nuclear extracts prepared from S2 cells transfected with lbr siRNA or control cells. The cells were treated with cycloheximide (CHX, 10 μg/ml) and harvested at the indicated time points. LAM, lamin. (F and G) Quantification of MTS level in nuclear (F) and cytoplasmic (G) fraction in (E). (H) Representative Western blots of cytoplasmic and nuclear extracts prepared from S2 cells transfected with pMT-lbr-Flag-HA or control cells. The cells were treated with cycloheximide (10 μg/ml) and harvested at the indicated time points. (I and J) Quantification of MTS level in nuclear (F) and cytoplasmic (G) fraction in (H). n = 3. Error bars represent SEM. Two-way ANOVA, Sidak’s multiple comparison test was used for (B) and (D). Student t test was used for (F), (G), (I), and (J). *P < 0.05. G, GAL; U, UAS.
