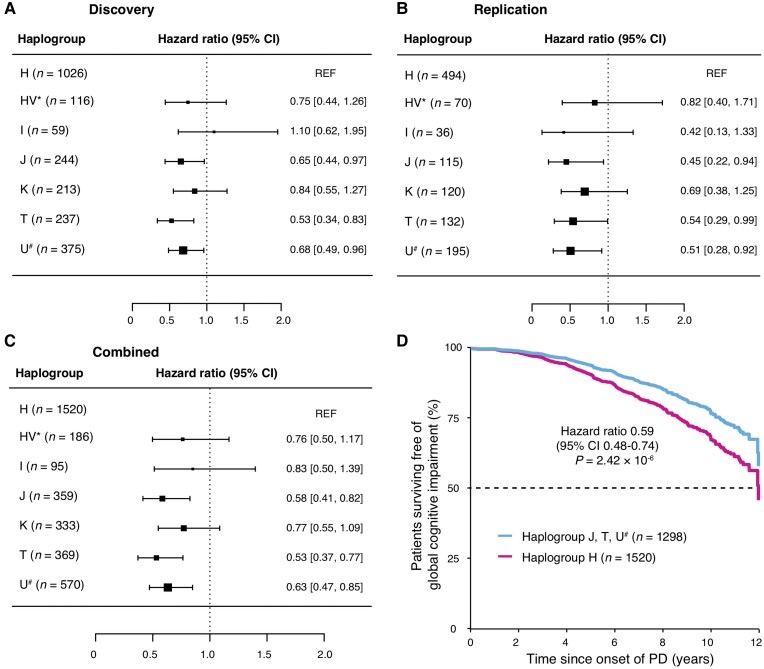
Figure 1.
Mitochondrial haplogroups and risk for GCI over time in patients with PD. The forest plot shows HRs for global cognitive impairment in specific types of macro-haplogroups compared to macro-haplogroup H in patients with PD from the discovery (A), replication (B) and combined (C) populations. The squares represent point estimates, with the sides of the square inversely proportional to the standard error of the estimates. The horizontal lines indicate 95% CIs of the estimates. (D) Covariate-adjusted survival curves for patients with PD in macro-haplogroups J, T and U# (cyan line) and those in macro-haplogroups H (magenta line).

