FIG. 4.
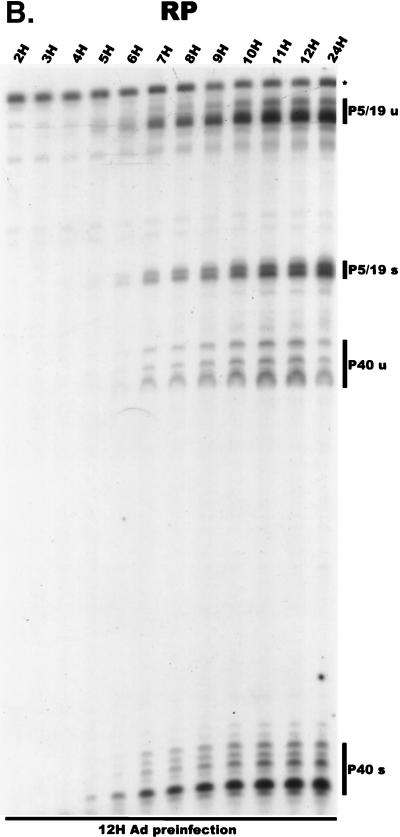
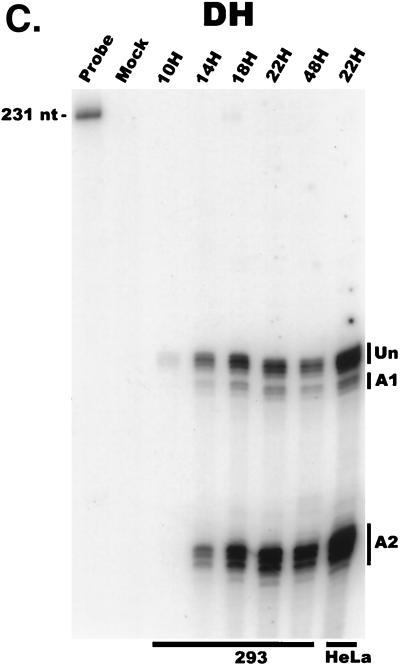
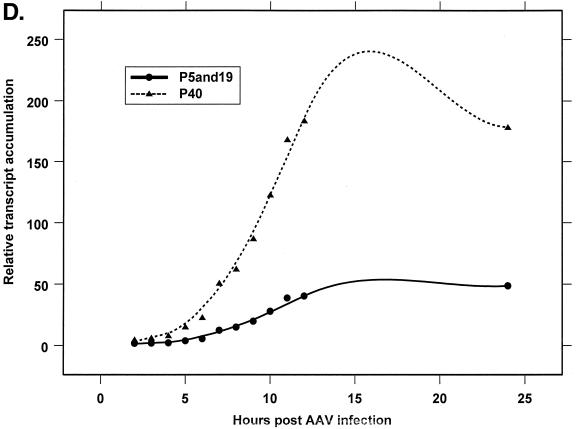
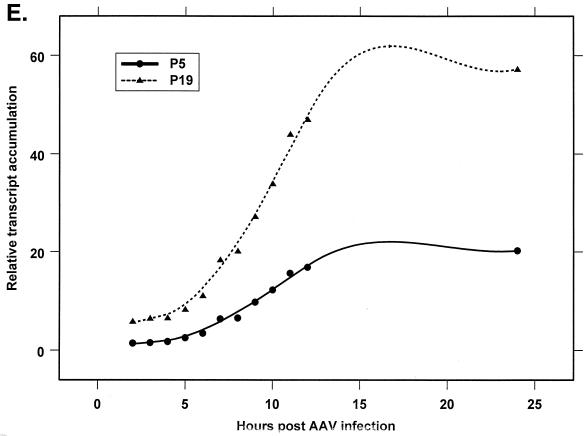
Analysis of AAV RNA stability and accumulation. (A) AAV RNAs are stable. The RP probe was used to protect AAV RNA exactly as described for Fig. 2A except that at 12 h after AAV-Ad coinfection 40 mM actinomycin D was added at time zero and RNA was isolated at indicated times after actinomycin D treatment (described in Materials and Methods). All AAV RNAs are present at high levels at the 6-h time point (Table 1). Comparison between lanes relied on equivalent loading conditions and multiple repetition of the experiment, since unpredictable effects of Ad on cellular RNAs precluded their use as an internal standard. u, unspliced; s, spliced. (B) AAV transcript accumulation over 1-h intervals during a productive AAV infection (RP probe). The RP probe was used to protect RNA exactly as for Fig. 2D except that Ad was preinfected for 12 h and total RNA was isolated at indicated time points after AAV infection at time zero. The asterisk indicates excess undigested RP probe. See panels D and E and Table 2 for quantification. (C) AAV transcript accumulation over 1-h intervals during a productive AAV infection (SB probe). The SB probe was used to protect the same RNA samples exactly as described for panel B. Asterisks indicate likely breakdown products pf P5 protected fragments and were excluded from quantification. See panels D and E and Table 2 for quantification. (D) P40-generated transcripts accumulate at a greater rate than P5- and P19-generated transcripts. P40 unspliced and spliced RNAs were quantified; values were combined and plotted versus combined quantified levels of P5 and P19 unspliced and spliced RNAs for each time point from the experiment shown in panel B. Rates were derived from these curves as described in Materials and Methods and are reported in Table 2. (E) P19-generated transcripts accumulate at a greater rate than P5-generated transcripts. Data from panel C are plotted exactly as in panel D and reported in Table 2.


