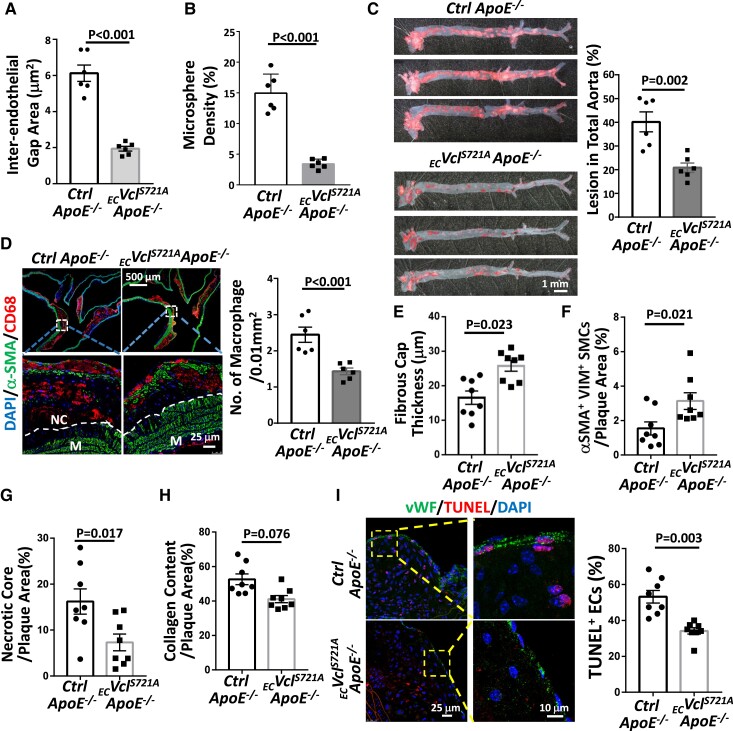
Figure 5.
EC-specific overexpression of non-phosphorylatable mutant VCLS721A in ApoE−/− mice reduces atherosclerotic lesions and increases plaque stability. ECVclS721AApoE−/− and inbred control ApoE−/− mice were fed HCD for 6 weeks (n = 6 each), and their aortas were subjected to en-face co-immunostaining for DDK-tagged VCLS721A and VE-cadherin. The inter-endothelial gaps between VE-cadherin junctions in the IA region were quantified (A). These mice were subjected to in vivo endothelial permeability assay using FITC-conjugated microspheres (G-spheres, 0.1 μm in size). The intensities of leaked microspheres in the endothelium of the IA region were quantified (B). (C–I) ECVclS721AApoE−/− and inbred control ApoE−/− mice were fed HCD for 18 weeks (n = 6 each in C and D, n = 8 each in E–I). Whole segments of mouse aortas were subjected to Oil-red O staining to examine plaque formation (C). (D) Cross-sections of IA from these mice were co-immunostained for macrophage marker CD68 and SMC marker αSMA, with DAPI nuclear counterstains. Lower panels show magnified views of the indicated areas (dashed line box). The dashed lines indicate the margin of the tunica medial layer (M). NC, necrotic core. The number of infiltrated macrophages in the lesions was quantified (n = 6). (E–I) Quantifications of fibrous cap thickness by Movat pentachrome staining (E), synthetic SMCs within the lesions by co-immunostaining for αSMA and vimentin (VIM) (F), necrotic core areas (identified as the regions that lack DAPI-positive nuclei) by DAPI counterstaining (G), and collagen content by PicroSirus red staining (H). The representative images of A, B, E, F, G, and H are shown in Supplementary material online, Figure S10A, B, D, E, and F, respectively. (J) Apoptotic ECs identified by TUNEL staining, with vWF as an EC marker. The number of apoptotic ECs in plaques was quantified. The right panels in I are the magnified views of the indicated areas (dashed line box). All analyses in E–I were performed on the sections of the innominate artery and the IA region of mice. Data are shown as means ± SEM and were analyzed by a two-tailed Student t-test. Results represent six to eight independent experiments with similar results.

