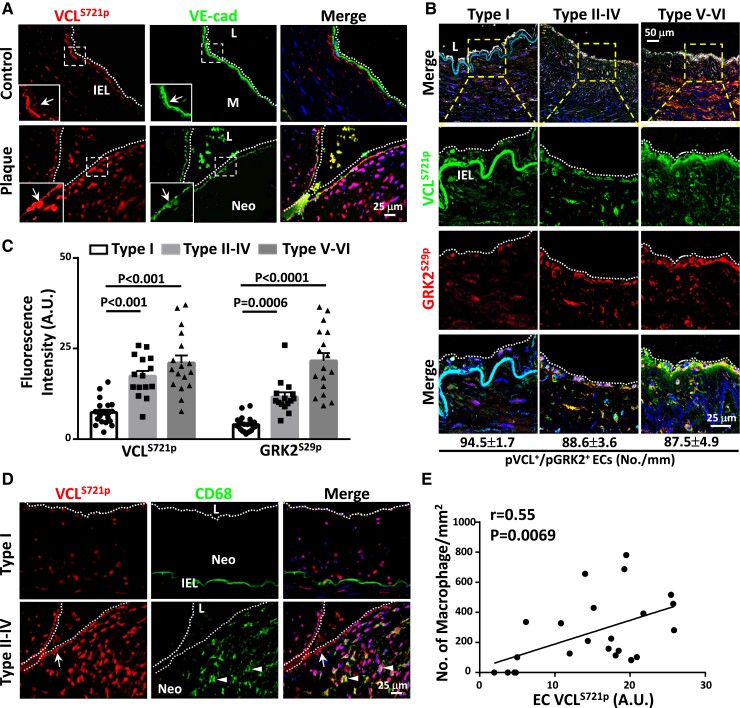
Figure 7.
Atheroma plaques rich in CD68-positive macrophages exhibit higher EC VCLS721p than initial lesions without intimal macrophages. (A) Cross-sections of diseased human coronary arteries and control internal thoracic arteries were co-immunostained for VCLS721p and VE-cadherin. Left-lower panels in each picture show the magnified views of the indicated areas (white dashed line box). (B) Representative images of co-immunostaining for VCLS721p and GRK2S29p, followed by immunostaining for EC marker IB4 to examine VCLS721p/GRK2S29p co-localization in ECs. The lower panels in each group are the magnified views of the indicated areas (dashed line box) in the top panels. The numbers of ECs co-expressing VCLS721p and GRK2S29p were quantified (n = 6 in each group) and shown at the bottom. (C) Quantifications of average fluorescence intensity (arbitrary units, A.U.s) of EC VCLS721p and GRK2S29p in cross-sections of initial neointima lesions (type I, group I) (n = 21), growing atheromas (types II–IV, group II) (n = 15), and advanced atheromas (types V–VI, group III) (n = 17). (D) Cross-sections of different types of atheromas were co-immunostained for VCLS721p and macrophage marker CD68. (E) Scatter plots showing a positive correlation between the average fluorescence intensities (arbitrary units, A.U.s) of EC VCLS721p and the numbers of CD68-positive macrophages in the examined human atheroma sections (n = 23, r = 0.5468, P = 0.0069). P-values and correlation coefficients (r) were calculated by using the Spearman correlation test. Cell nuclei were counterstained with DAPI. Data in C are means ± SEM and were analyzed by two-way ANOVA with Tukey multiple comparison test. Arrows in A and D indicate the VCLS721p-positive EC layers. Arrowheads in D indicate CD68-positive macrophages. The dotted lines in A, B, and D indicate the margins of the vessel lumen. IEL, internal elastic lamina; L, lumen; M, medial region; Neo, neointima. Pictured images represent at least six independent experiments with similar results.

