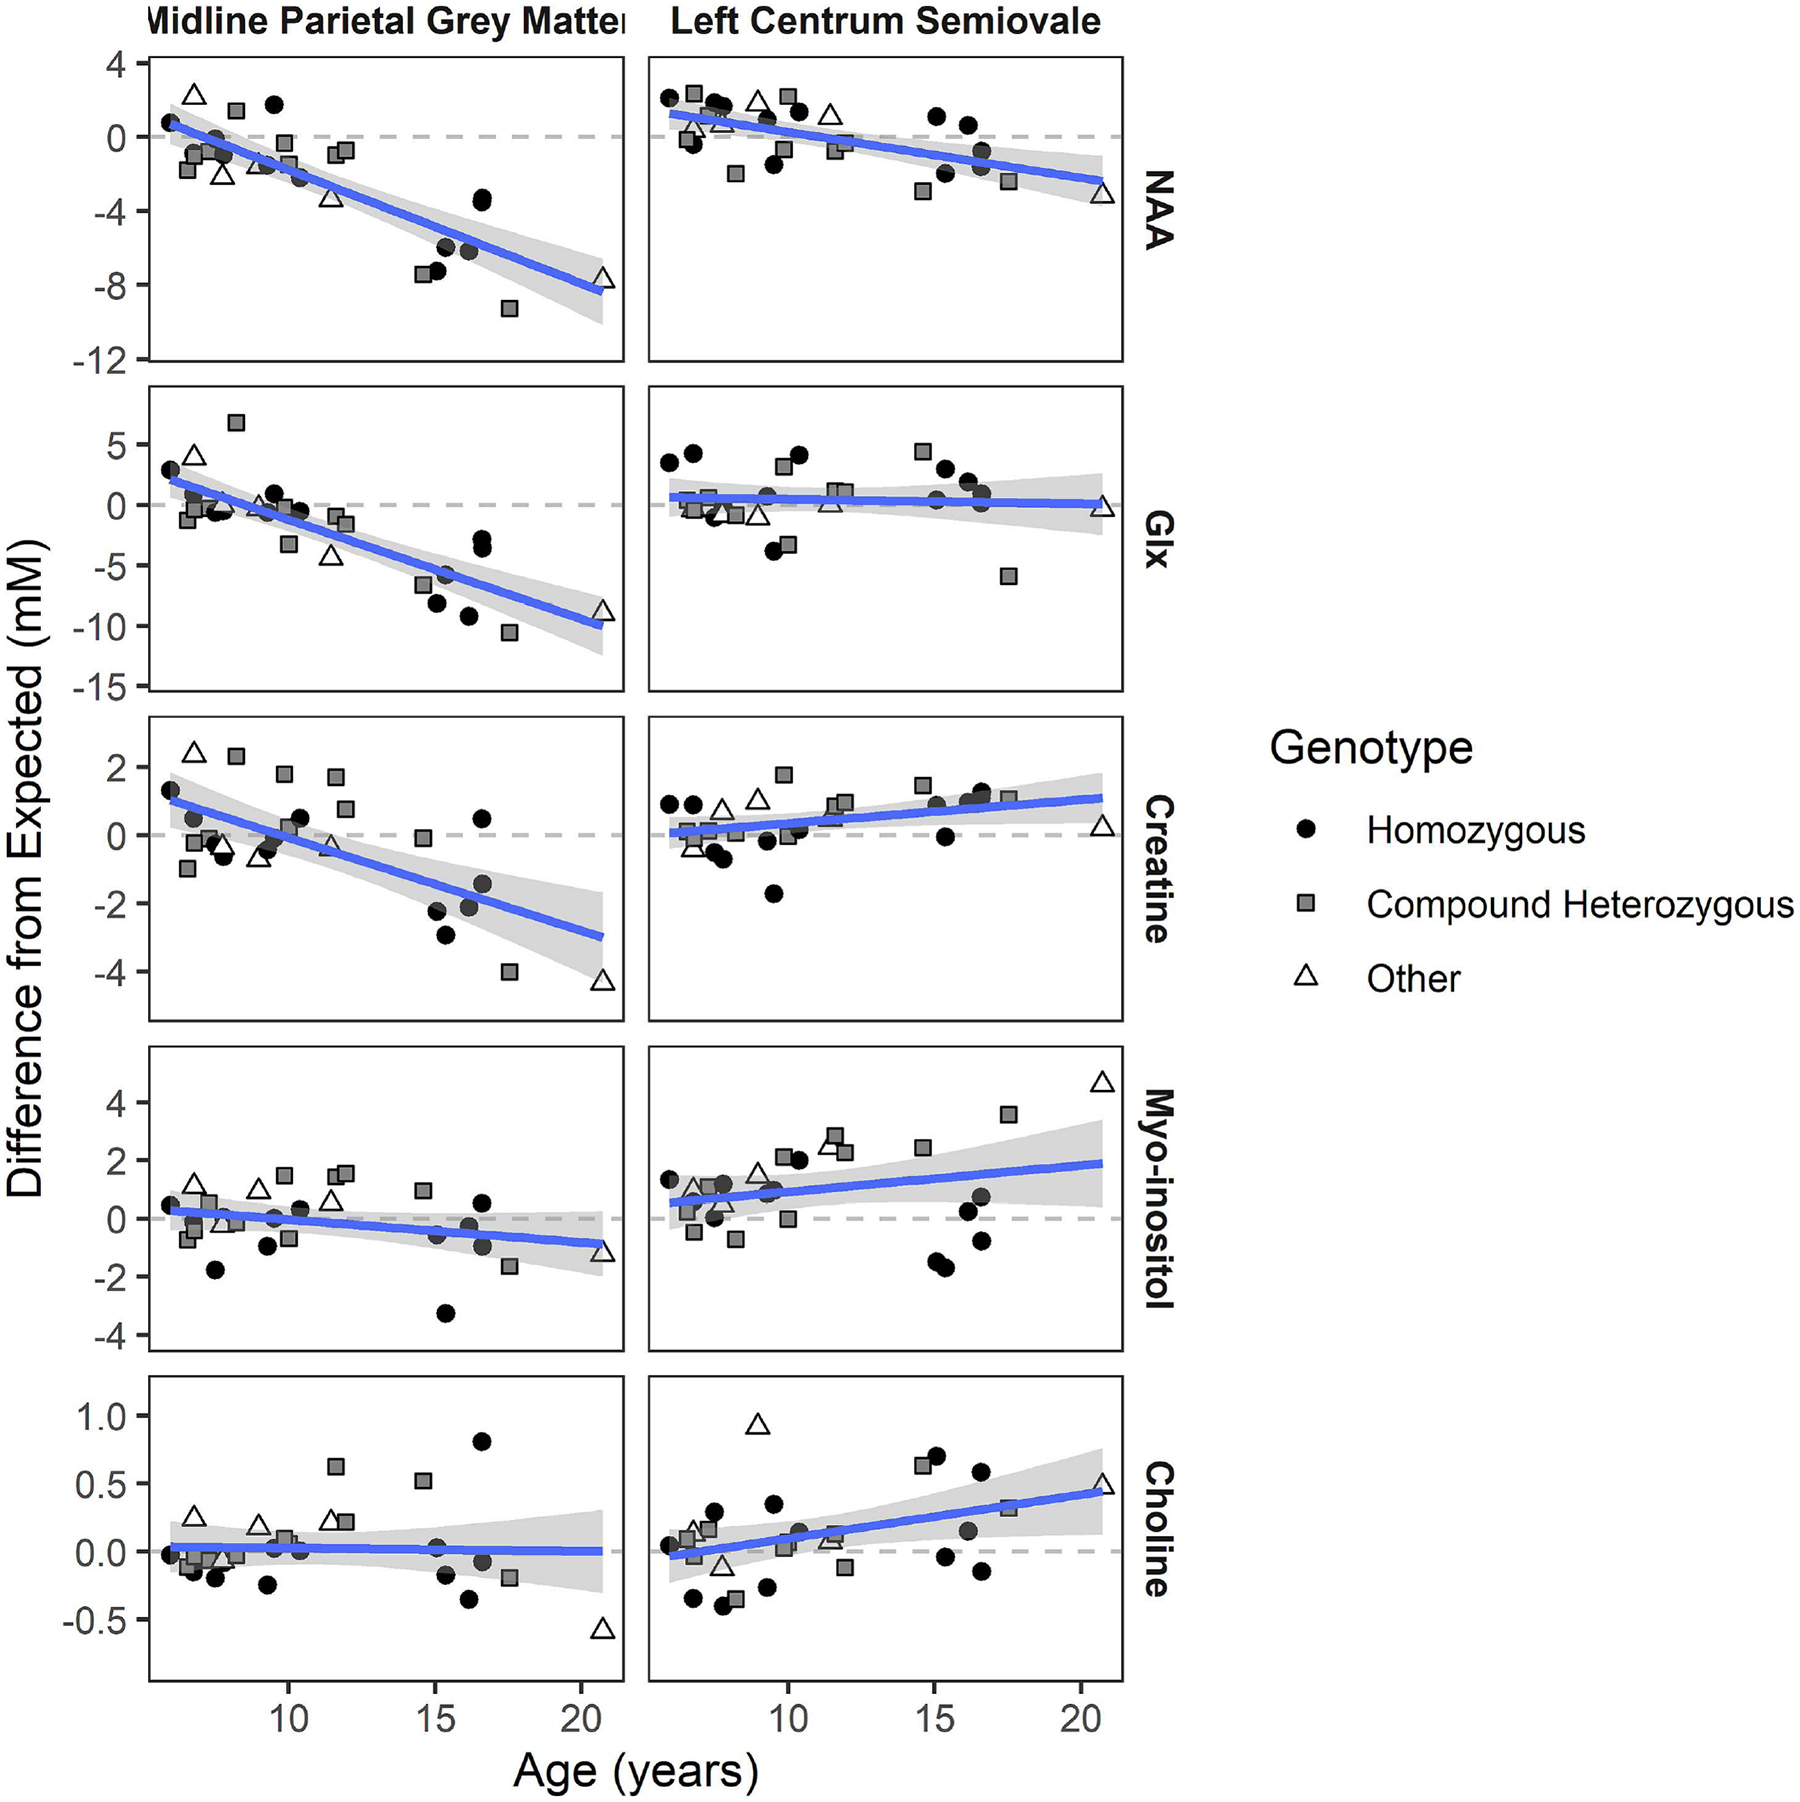
Fig. 1. Age progression of metabolites relative to normative values.

NAA: N-acetyl aspartic acid. Glx: Glu+Gln+GABA Regression line shows average effect of age on difference in concentration from age expectation, which is illustrated by the dotted line at zero (shaded area is 95% CI). Individual data points are coded by genotype. Slopes and test statistics for age are listed in Table 1. Homozygous: biallelic 966-bp deletion variants. Compound heterozygous: 966-bp deletion in trans with a non 966-bp deletion variant. Other: biallelic non 966-bp variants.
