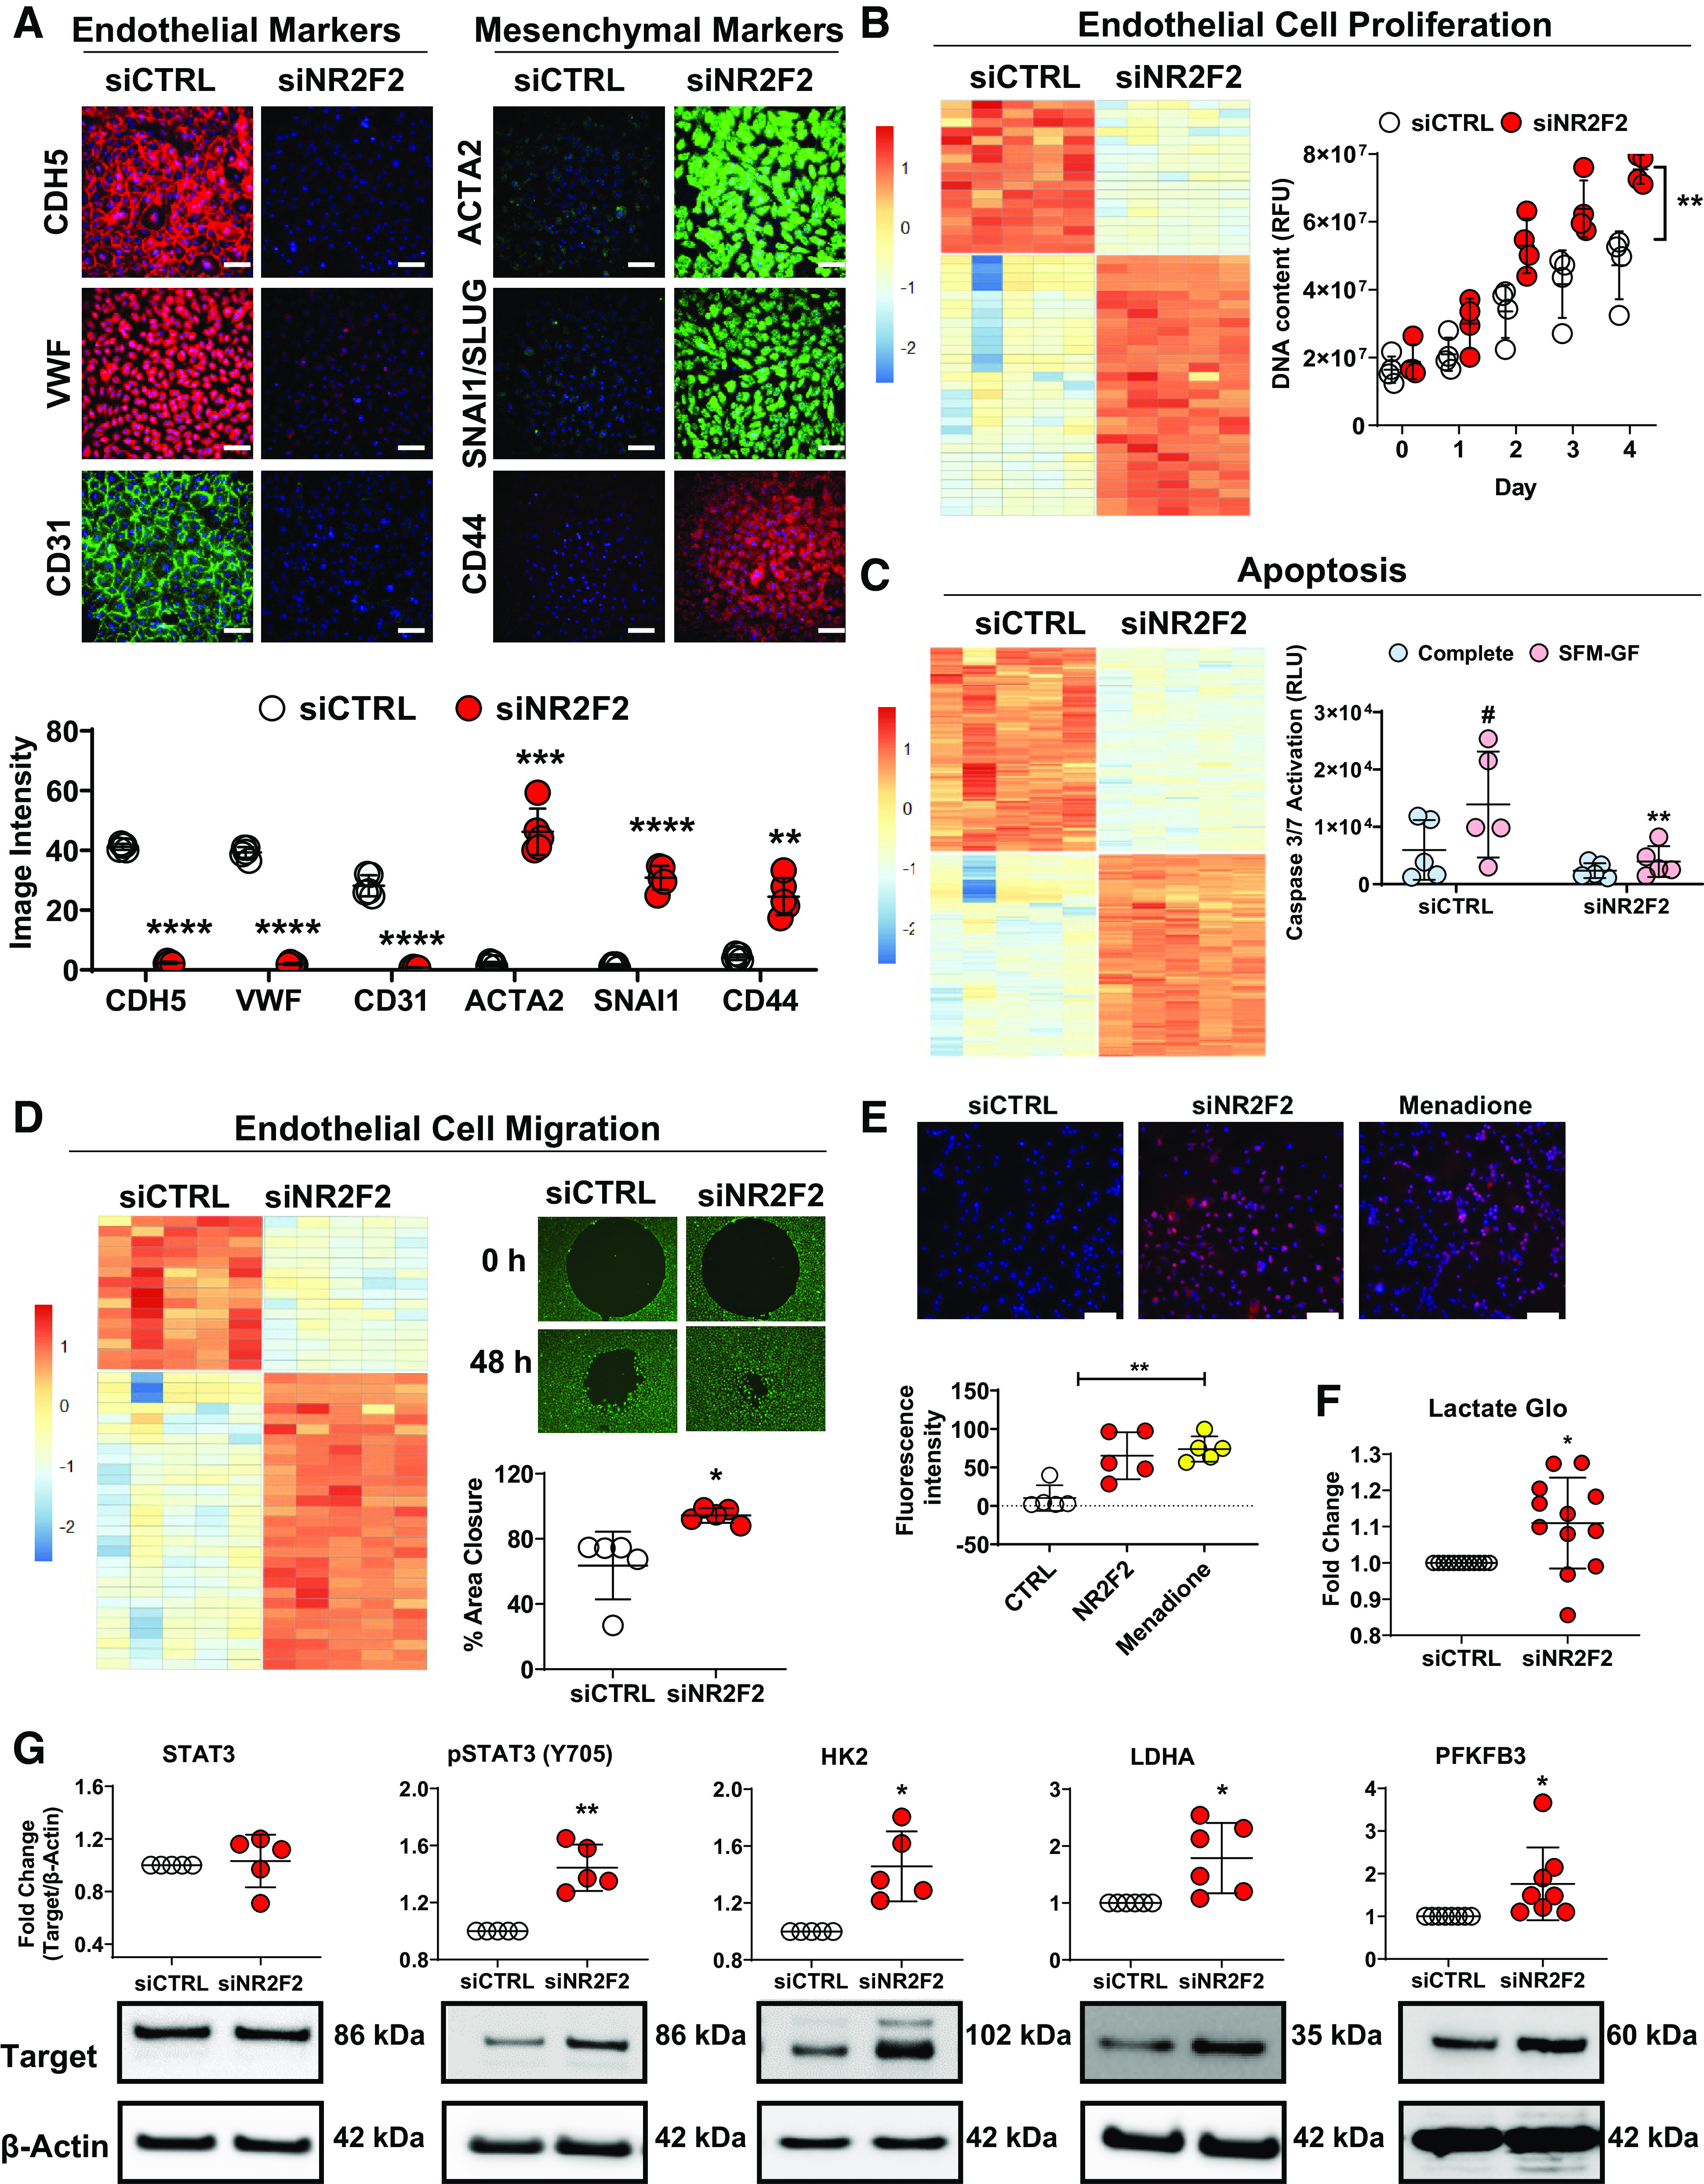
Figure 3.

NR2F2-silenced human pulmonary artery endothelial cells (PAECs) and lung microvascular endothelial cells (LMVECs) exhibit endothelial to mesenchymal transition with increased proliferation and migration, resistance to apoptosis and altered metabolism. PAECs were transiently transfected with either control (siCTRL) or NR2F2 siRNA (siNR2F2) for 72 h. A: NR2F2 loss led to the downregulation of endothelial [CDH5 (VE-cadherin), VWF and CD31 (PECAM1)] and upregulation of mesenchymal [ACTA2 (α-smooth muscle actin), SNAI1/SLUG and CD44] marker by immunofluorescent microscopy (n = 5; top). Fluorescence intensity is quantified (bottom). Scale bar, 100 µm. B: heatmap (left) of Ingenuity Pathway Analysis (IPA)-annotated genes related to proliferation (n = 48; P = 2.61E−11; Supplemental Table S10) among the differentially regulated transcripts in NR2F2-silenced LMVECs (814 annotated, nonredundant transcripts; false discovery rate ≤1% and fold-change >1.5; Supplemental Table S6). NR2F2 knockdown in PAECs (72 h) also increased proliferation as assessed by CyQUANT cell proliferation assay (right; n = 4). C: heatmap (left) of IPA-annotated genes related to apoptosis (n = 293; P value 1.21E−32; Supplemental Table S10) among the gene expression changes in LMVECs. Following NR2F2 knockdown in LMVECs (48 h), LMVECs were resistant to apoptosis as assessed by caspase 3/7 reporter assay (right) following 24 h of continued growth in serum-free media without growth factors (SFM-GF; n = 5). D: heatmap (left) of IPA-annotated genes related to endothelial cell migration (n = 44; P = 3.16E−9; Supplemental Table S10) among the gene expression changes in LMVECs. NR2F2 knockdown in LMVECs (48 h) resulted in hypermigration as assessed by cell migration assay. After NR2F2 knockdown, LMVECs were transferred to 96-well plates containing a circular insert and percent area closure was quantified 48 h later (n = 5). E: PAECs were transiently transfected with either control (siCTRL) or NR2F2 siRNA (siNR2F2) for 48 h and stained with CellROXDeep Red and Hoescht (blue; 10 μM; upper). Nontransfected duplicate wells were treated with menadione (1 μM), an oxidant stress inducer, and stained as above. Scale bar, 100 µm. Fluorescence intensity was quantified (n = 5; lower). F: following transfection as above, PAEC cell culture supernatants (n = 11) were subjected to Lactate-Glo assay. G: Western blots of whole cell lysates from PAECs, transfected as above, for total and phosphorylated STAT3 (Y706; n = 5), HK2 (n = 5), LDHA (n = 6), and PFKFB3 (n = 8). Data are presented as means ± SD. *P ≤ 0.05, **P ≤ 0.01, ***P ≤ 0.001, ****P ≤ 0.0001 siNR2F2 vs. siCTRL; #P ≤ 0.05, SFM-GF vs. complete medium by paired t test (A, D, F, G) or two-way ANOVA (B, C) or one-way ANOVA (E).
