FIGURE 4.

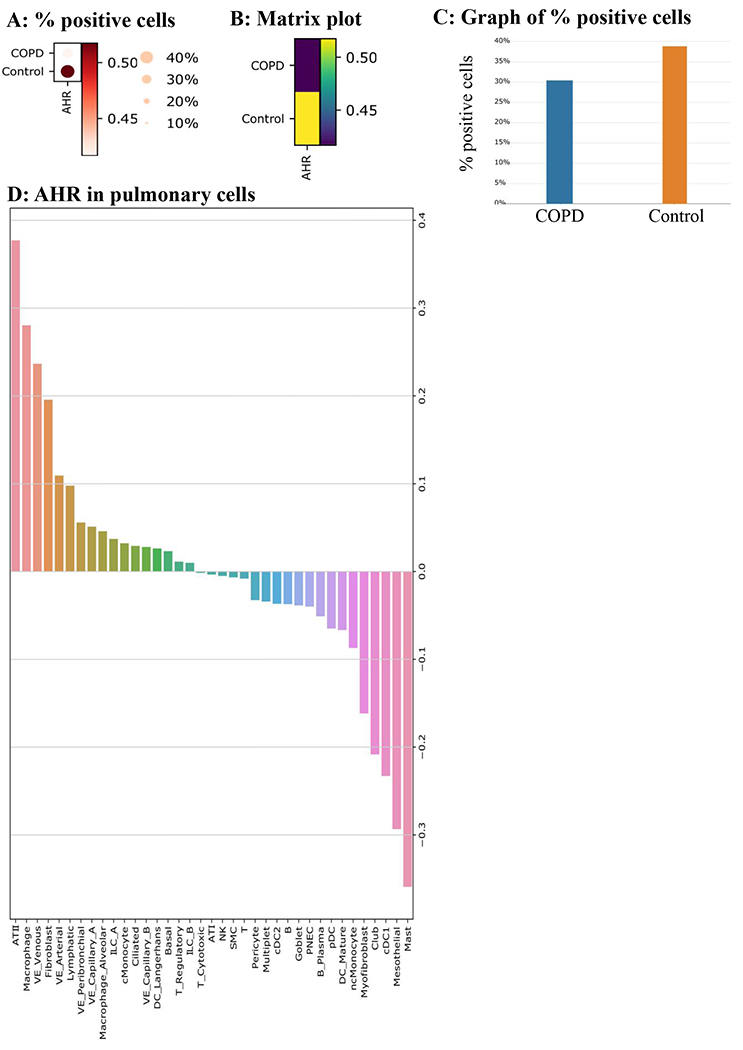
AHR expression is significantly lower in COPD cells compared to Control cells. A: % positive cells- AHR is lower in COPD, as indicated in a dot plot. The size of the dot represents the % of cells with positive AHR expression. The grade of the dot color represents the AHR expression level. B: Matrix Plot- A matrix plot for AHR in COPD vs. Control. C: Graph of % positive cells- COPD has 30.5% AHR positive cells, while 38.9% of Control cells are AHR positive. D. Percent difference of AHR positive cells between COPD and Control for each pulmonary cell type. The most considerable positive difference is observed in ATII cell type (many more AHR positive cells in COPD vs. Control), while the largest negative difference (much less AHR positive cells in COPD vs. Control) is found in mast cells.
