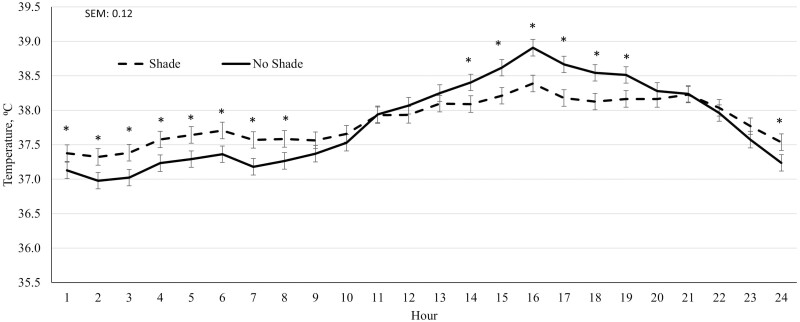
Figure 7.
Effect of treatment (SHADE or NO SHADE) on ear temperature of cattle during Heat Event 1 (May 24 to June 1) in year 2. Ear temperature was measured 5 times per hour using a biometric sense tag (Quantified Ag, Lincoln, NE). The interaction between treatment and hour was significant (P = 0.06). Hourly data averaged across days to get one data point per hour. Treatment difference within hour are significant (P < 0.05) at time points denoted with an *.

