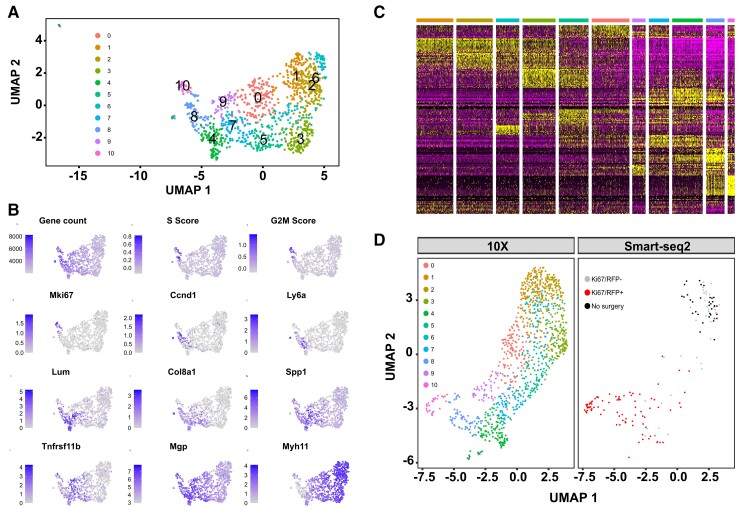
Figure 4.
Gradual changes from the contractile to a proliferation-associated expression signature. (A) Uniform Manifold Approximation and Projection (UMAP) with cell cluster map for scRNA-seq analysis of 1103 VSMC-lineage label positive cells from left carotid arteries 7 days after ligation. A cell cluster representing a minor VSMC population (Cluster 11, 23 cells) is not shown, see Supplementary material online, Figure S5. (B) UMAP plots showing gene count, cell cycle scores, and marker gene expression levels using grey-blue scales. (C) Heatmap showing expression of the top cluster markers using a scale from purple (low) to yellow (high). Top bar shows cluster affiliation using colour scale from (A). (D) UMAP after integration of 10× and Smart-seq2 scRNA-seq data (both Day 7), split by dataset. Colours show cell clusters (10 × dataset, left) and index-sort identity (Smart-seq2 dataset, right; cells from unligated control animals in black, and cells from ligated left carotid arteries 7 days after surgery in red (KI67/RFP+) or grey (KI67/RFP-)).

