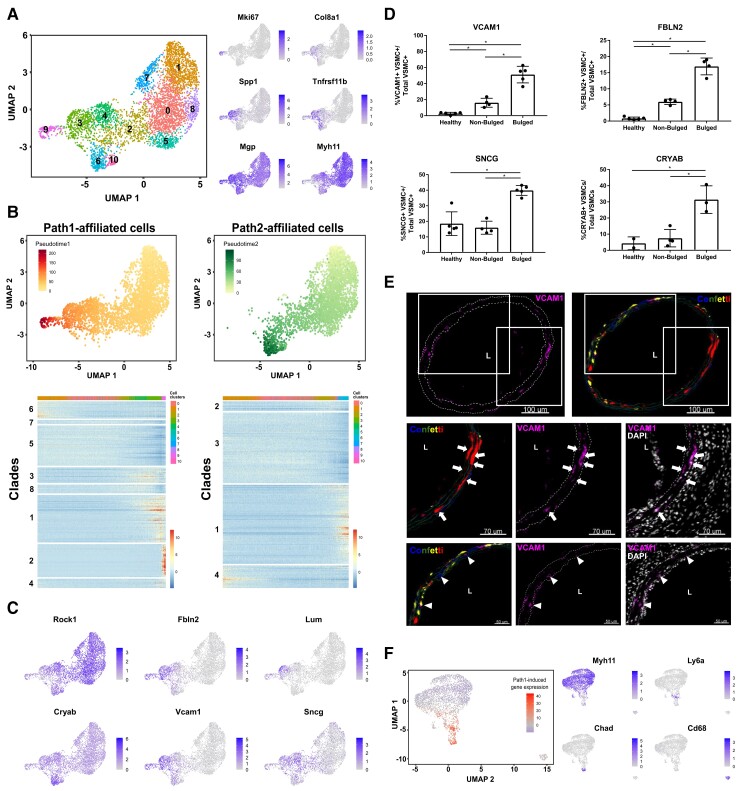
Figure 5.
Characterization of injury-induced gene expression at the onset of VSMC proliferation. (A) UMAP showing cell clusters (left) and marker gene expression levels using grey-blue scales (right) in a scRNA-seq (10 × Chromium) dataset of 4469 VSMC-lineage label-positive cells from ligated left carotid arteries 5 days after surgery. (B) Top panels are UMAPs showing only cells that are part of Path1 (left) or Path2 (right) with pseudotimes for each path indicated using a yellow-red (Path1, left) or yellow-green scale (Path2, right). Lower panels show heatmaps of genes with significant path-associated expression [P-adj < 0.05, log(fold-change) > 0.5], clustered into 8 (Path1, left) or 4 (Path2, right) gene clades. (C) UMAP showing expression of selected trajectory-associated genes using grey-blue scales. (D) Percentage of lineage-labelled VSMCs (VSMC+) expressing FBLN2, CRYAB, SNCG, and VCAM1 in arteries from control animals (healthy), and in non-bulged and bulged regions of injured arteries 5–7 days post-ligation (Myh11-Confetti or Myh11-EYFP animals). Mean and standard deviation are shown. Dots show average of multiple sections from each animal. Asterisk indicates P < 0.05 (Welch’s one-way ANOVA and Dunnett’s post-hoc test). (E) Representative immunofluorescence staining for VCAM1 in cryosections from bulged regions of ligated carotid arteries from VSMC-lineage-labelled Myh11-Confetti animals 5–7 days after ligation surgery (n = 5). Panels show the entire artery (top) and magnified views of boxed regions (middle and lower). Signals for VCAM1 (magenta), Confetti (CFP: blue, RFP: red, YFP: yellow, GFP: green) and DAPI (white) are shown as indicated. Arrows point to VCAM1+ cells in patches and arrowheads point to VCAM1+ singlet VSMCs. The lumen (L) is indicated. Scale bars = 100 µm (top), 70 µm (middle), and 50 µm (lower panels). (F) UMAP of scRNA-seq dataset from VSMC-lineage-labelled cells from Myh11-Confetti-Apoe animals fed a high fat diet.13 Left, summarized expression of Path1-induced genes (Path1 Clades 1, 2, 3, 4, 8) on a blue (low)-to-red (high) scale. Right, expression of VSMC-derived cell markers (Myh11: contractile, Ly6a: mesenchymal stem cell-like; Chad: osteochondrogenic; Cd68: macrophage) in grey-blue scales.

