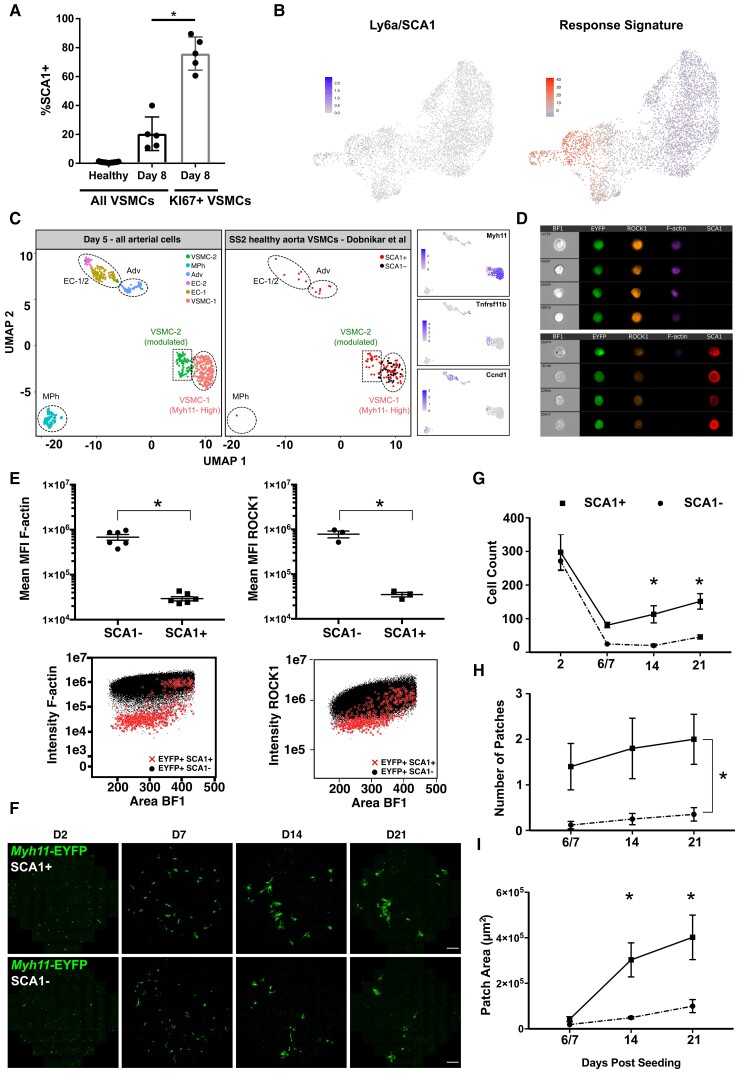
Figure 6.
SCA1 marks VSMCs with increased proliferative capacity. (A) Percentage of SCA1-expressing cells out of all EYFP+ VSMCs (black bars) or EYFP+KI67/RFP+VSMCs (grey bar) in left carotid arteries of Myh11-EYFP-KI67/RFP animals analysed by flow cytometry, showing data for individual animals (dots), mean, and standard deviation [n = 17 (healthy) or 5 (Day 8 post-ligation)]. (B) UMAP of D5 VSMC scRNA-seq dataset showing expression of Ly6a/SCA1 using a scale from grey-blue (top) or summarized expression of the ‘Response Signature’ identified in SCA1+VSMCs from healthy arteries13 on a blue-red scale (lower panel). (C) Integration of scRNA-seq profiles of all arterial cells analysed 5 days post-carotid ligation (Day 5 all) with Smart-Seq2 dataset of cells from healthy arteries.13 Left panel shows cell cluster identity in the ‘Day 5 all’ dataset (see Supplementary material online, Figure S6), middle panel shows SCA1+ (red) and SCA1− (black) VSMCs from healthy arteries and right-hand panels show expression of Myh11, Tnfrsf11b, and Ccnd1 in the integrated dataset. (D) ImageStream bright field (BF) and fluorescence images of medial cells from the aortae of VSMC-lineage-labelled Myh11-EYFP animals stained for SCA1 (red), ROCK1 (orange), and F-actin (magenta, phalloidin) with VSMC-lineage label (EYFP) in green. (E) Quantification of (D). Dots show mean of MFI (mean fluorescence intensity) for SCA1− and SCA1+ cells (gating, see Supplementary material online, Figure S14) from each animal (F-actin, n = 6; ROCK1, n = 3), and mean and S.E.M. across animals are indicated. Asterisks: P < 0.05, t-test. (F–I) Comparison of clonal proliferation for SCA1+ or SCA1− VSMCs (EYFP+) from Myh11-EYFP animals mixed with medial cells from wild-type animals in a 1:9 ratio. (F) Representative live confocal images. EYFP signals are shown in green. Scale bar = 100 μm. Quantification of cell count per well (G), number of patches per well (H), and mean area of patches per well (I) for wells containing EYFP+SCA1+ (squares, solid lines) and EYFP+SCA1− cells (circles, dotted lines) at indicated time points post-seeding. Plots show mean and S.E.M. of cells from three animals analysed separately. Statistical significance (asterisks indicate P < 0.05) of cell count differences at individual days was tested by ANOVA (G); patch numbers were fitted to a generalized linear model (H); multiple linear regression was performed on log-transformed data for patch area (I).

