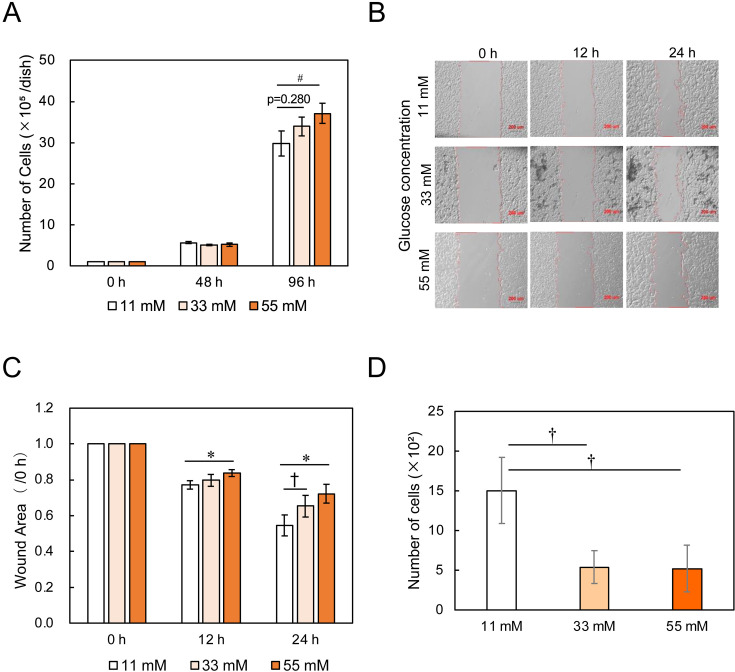
Fig. 3.
Effects of glucose concentrations on the metastasis-associated in vitro properties of B16-F10 cells. (A) Cell proliferation. Bars are mean ± SD, for n=3. (B) Microscopic images of wound areas in the migration assay. Scale bar: 200 µm. (C) Cell migration activity. Bars are mean ± SD, for n=4. (D) Cell invasion activity. Bars are mean ± SD, for n=3.

