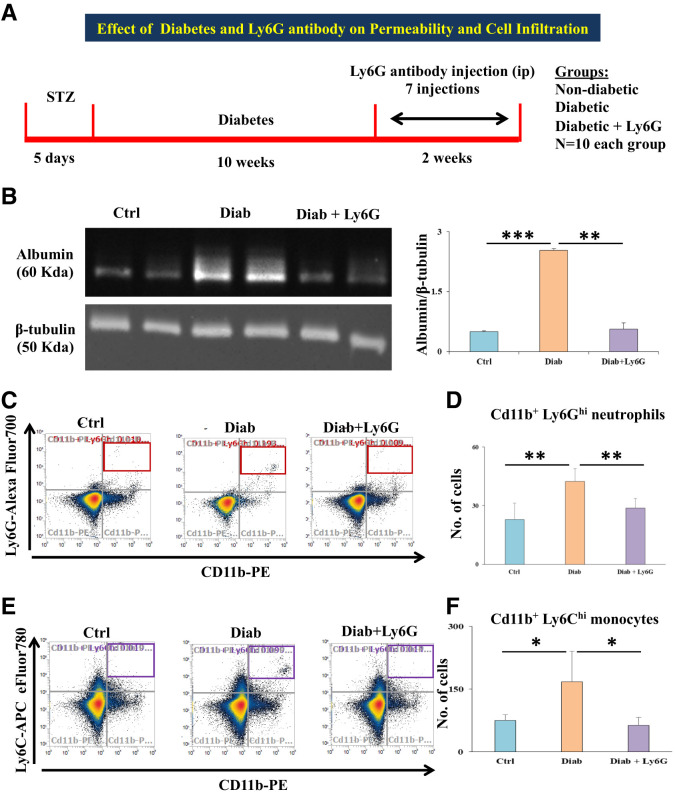
Figure 5.
A: Schematic representation of the experimental design and groups are depicted. B: Representative Western blot images of albumin and β-tubulin; the histogram on the right-hand side shows significantly increased albumin level in the retinas of diabetic animals compared with that in nondiabetic animals. Meanwhile, the albumin level was significantly decreased in diabetic + Ly6G-treated animal retinas compared with diabetic animal retinas. C: Representative dot plots of flow cytometric analysis for neutrophils (gated for Cd11b+/Ly6Ghi in red box at the top right quadrant) of different experimental groups: control (vehicle), diabetic, and diabetic + Ly6G. D: Total number of neutrophils was significantly increased in the retinas of diabetic animals compared with nondiabetic animal retinas; the neutrophil count was significantly decreased in Ly6G antibody–treated diabetic animal retinas compared with retinas of diabetic animals that did not receive this treatment. E: Representative dot plots of flow cytometric analysis for monocytes (gated for Cd11b+/Ly6Chi in purple box at the top right quadrant) of different experimental groups. F: Total number of monocytes was significantly increased in the retinas of diabetic animals compared with nondiabetic (control) animal retinas. Ly6G antibody treatment in diabetic animals significantly reduced the influx of both monocytes compared with in diabetic animals that did not receive this treatment. Data are presented as mean ± SD. *P < 0.05, **P < 0.01, ***P < 0.001. Diab, positive for diabetes.

