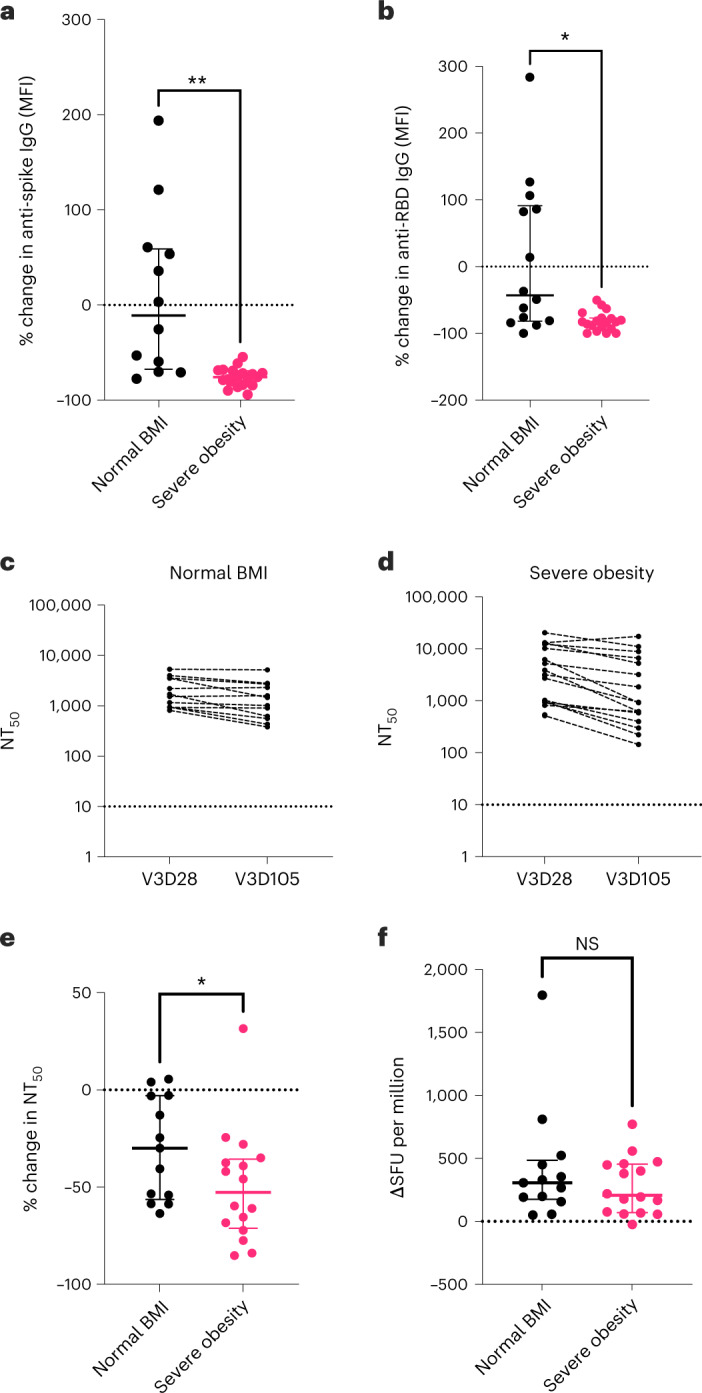
Fig. 4. Third-dose COVID-19 vaccine-induced immunity in individuals with severe obesity.

Individuals with severe obesity (n = 19, magenta) and normal BMI controls (n = 14, black) were studied at day 28 and day 105 after the third vaccine dose. a, Percentage (%) change in anti-spike IgG antibody levels (MFI). Horizontal bars indicate the median and interquartile range (**P = 0.0057 in Welch’s t-test). b, Percentage (%) change in anti-RBD IgG antibody levels between these two timepoints. Horizontal bars indicate the median and interquartile range (*P = 0.0102 in Welch’s t-test). c,d, NT50 measured at 28 d (V3D28) and 105 d (V3D105) after third-dose vaccination (V3) in normal BMI controls (c) and individuals with severe obesity (d). e, Percentage (%) change in NT50 against wild-type SARS-CoV-2, with the dotted line indicating the limit of quantification. Horizontal bars indicate the median and interquartile range (*P = 0.0448 in Mann–Whitney test). Dotted line indicates no change. f, T cell responses quantified by ELISpot. Horizontal bars indicate the median and interquartile range. Individuals who reported a positive SARS-CoV-2 RT–PCR test between day 28 and day 105 or who had positive anti-nucleocapsid antibodies at day 105 were excluded from these analyses. NS, not significant.
