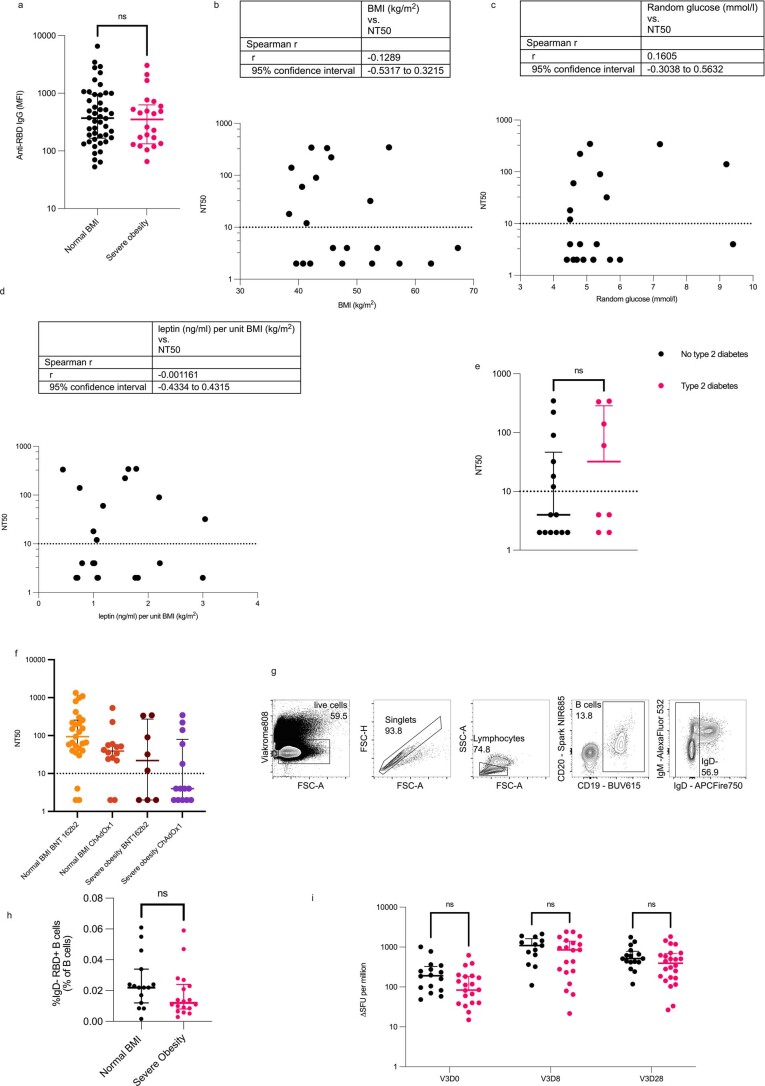
Extended Data Fig. 3. SARS-CoV-2 vaccine-induced immunity in people with severe obesity and normal BMI.
a, Anti-RBD (receptor binding domain) IgG titres are comparable in 6 months after primary vaccination course (P = 0.5801 in Mann-Whitney U test) in people with severe obesity (N = 22) and normal BMI (46). b-e, Correlation between body mass index (BMI), random blood glucose, leptin levels per unit BMI in people with severe obesity (n = 22) and the presence (=8) or absence of type 2 diabetes (n = 14) and neutralizing capacity (NT50) 6 months after second dose. Non-parametric Spearman’s Rho correlations were calculated between NT50 and clinical parameters. Dotted line indicates the limit of quantification. A Mann-Whitney test was used to compare people with severe obesity with and without diabetes mellitus. f, Neutralizing capacity (NT50) 6 months after second dose by primary vaccination course - Pfizer-BioNTech BNT162b2 mRNA or AstraZeneca ChAdOx1. Dotted line indicates the limit of quantification. g, shows the B cell Pre-gating used in the flow cytometry analysis. h, shows the frequency of antigen-experienced (IgD-) Receptor Binding Domain binding (RBD + ), 6 months after the primary vaccination course; data expressed as a percentage (%) of the total number of B-cells in people with severe obesity (n = 15) and normal BMI (n = 18). Compared in Mann-Whitney U test. i, Antigen-specific T cell responses were measured by ELISpot. Interferon gamma spot forming units (SFU) were quantified. Analysed in mixed effects model. Each symbol represents an individual person and line indicates the median with interquartile range; black symbols indicate people with normal BMI (n = 16) and magenta people with severe obesity (n = 22). Ns, not significant. V3D0 is before third dose vaccination (V3), V3D8 is 8 days after third dose and V3D28 is 28 days after third dose vaccination.

