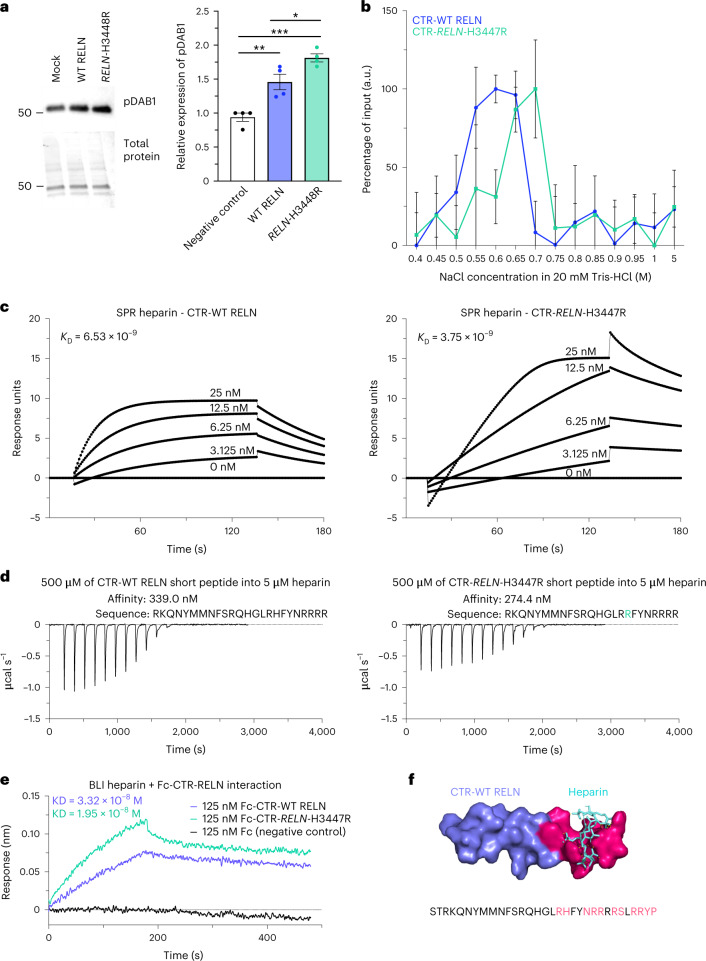
Fig. 2. The RELN-H3448R variant enhances Dab1 signaling and the affinity of CTR-RELN to heparin.
a, Representative western blotting of pDab1 levels (top) and total protein staining (bottom) levels in primary mouse cortical neurons treated with full-length WT RELN or RELN-H3448R, mouse ortholog of RELN-H3447R (mock, P < 0.0029 and WT RELN, P = 0.0246). Data are presented as the mean ± s.e.m. and were analyzed using a Kruskal–Wallis test with Dunn post hoc analysis for multiple comparisons of n = 4 independent biological experiments. b, Spectroscopic analysis of heparin chromatography fractions of WT CTR-RELN (blue plot) and the CTR-RELN-H3447R mutant (green plot) eluted at increasing gradients of NaCl (0.05 M NaCl step gradient). Data are expressed as the percentage of input over 0.4–5 M NaCl gradient fractions. Data show that 0.55 M NaCl can displace WT CTR-RELN binding from a heparin column. The affinity for heparin of CTR-RELN increases in the presence of the H3447R mutation, as suggested by the shift of the peak with maximum height of the eluted fraction from 0.55 to 0.7 M NaCl. n = 3 independent chromatography experiments. The error bars represent the s.e.m. c, Representative sensorgrams of the binding analysis between chip sensors coated with heparin and 0–25 nM increasing concentrations of CTR-RELN variants. Data are expressed as response units per second. The equilibrium disassociation constant (KD) for each SPR analysis are shown inside the graph and support the difference in affinity binding between heparin and the CTR-RELN variants: H3447R (right plot, KD = 3.75 × 10⁻⁹ M-1 s-1) > H3347 (left plot, KD = 6.53 × 10⁻⁹ M-1 s-1). The sensorgrams of CTR-RELN with the H3447K and H3447D control variants are reported in Supplementary Fig. 6 for comparison. d, Isothermal calorimetry measurements of short-variant WT CTR-RELN (left) and CTR-RELN-H3447R (right) titrated with 5 μM heparin. Affinity calculations are reported above each plot. e, Binding analysis via BLI between Fc-fusion WT CTR-RELN and H3447R and a heparin-coated biosensor. Association (ka) and dissociation constants (kd) were used to calculate the KD that is displayed in the plot. f, Docking of WT CTR-RELN (purple) with a representative heparin molecule (cyan). Amino acids in CTR-RELN that have polar contacts with heparin are highlighted in magenta.

