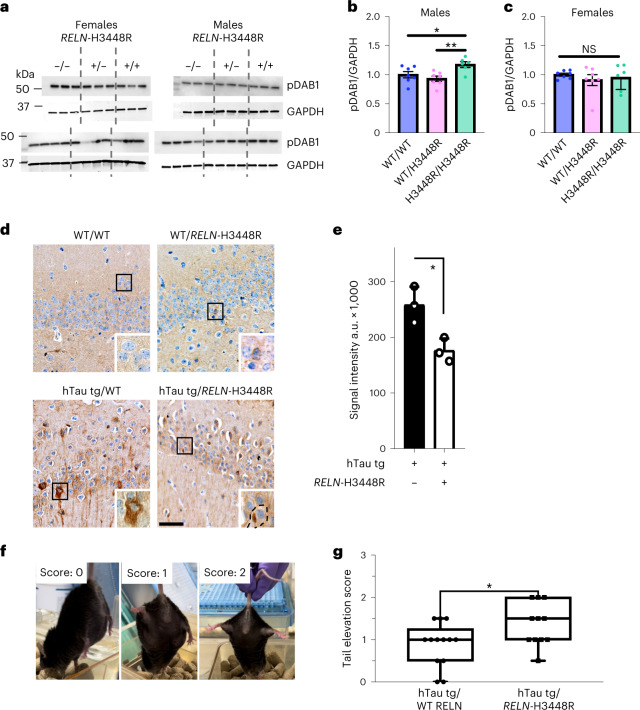
Fig. 4. RELN-H3448R homozygosity promotes pDab1 signaling, reduces Tau hyperphosphorylation and preserves motor functions in mice.
a, Representative western blots of pDab1 (top) and GAPDH levels (bottom) detected in the CB of both female (left) and male (right) mice either WT (WT/WT RELN), heterozygous (WT RELN/H3448R) or homozygous (RELN-H3448R/H3448R) for the mRELN-H3448R mutation. Levels of pDab1 were detected in 6–12-month-old mice. b,c, Quantifications of pDab1 levels normalized to GAPDH and expressed as the fold change of WT RELN showing a genotype effect in pDab1 levels in male mice (b) but not female mice (c). *P = 0.0284 for WT/WT, n = 7 mice versus H3448R/H3448R, n = 6 mice, t = 1.001, d.f. = 17; **P = 0.0037 for WT/H3448R, n = 7 mice versus H3448R/H3448R, n = 6 mice, t = 3.356, d.f. = 17, one-way analysis of variance (ANOVA). Data are expressed as the average ± s.e.m. Analyses of pDab1 levels in male mice at 3 months of age and in other brain regions are shown in Extended Data Fig. 5. Validation of the anti-pDab1 antibody used in a and e is reported in Supplementary Figs. 5 and 6. d, Representative immunohistochemistry (IHC) images from the HIC of WT/WT, WT/RELN-H3448R, hTau tg/WT and hTau tg/RELN-H3448R mice stained with hyperphosphorylated Tau (pTau) T205 antibody. hTau tg/WT mice showed neurofibrillary tangles and neuropil threads in the first region of the hippocampal circuit (CA1) and dentate gyrus, while hTau tg/RELN-H3448R showed Tau pathology to a lesser degree (soma of an affected neuron depicted with a dotted line). Bar scale, 100 μm. e, Bar graph for pTau T205 signal intensity values in hTau tg/WT (n = 3 mice) and hTau tg/RELN-H3448R mice (n = 3 mice). The latter showed significantly lower signal intensity. *P = 0.022, two-sided Student’s t-test. The error bars represent the s.d. from the mean. f, Representative phenotype observed during the tail elevation test and relative score (0 = severely impaired, 1 = 50% impaired, 2 = normal). g, Tail elevation recorded on WT RELN/Tau-P301L (n = 13 male mice) and RELN-H3448R/Tau-P301L crossed male mice (n = 11 male mice) showed a significantly improved tail elevation score in the presence of the RELN-H3448R variant compared to Tau-P301L mice expressing WT RELN (*P = 0.0305, two-tailed unpaired t-test, t = 2.313, d.f. = 22). Box plots are expressed as minimum to maximum values around the average.

