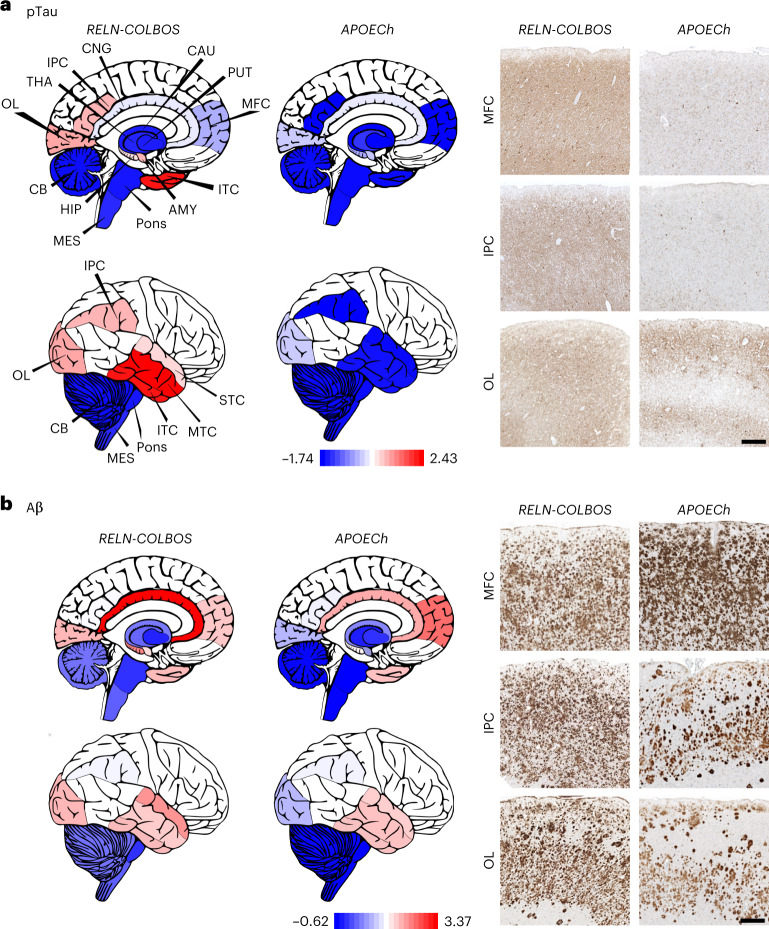
Fig. 6. Brain distribution of AD hallmarks in the cases with RELN-COLBOS and APOECh.
a,b, Graphic representation and representative images of the distribution and intensity of pTau (a) and Aβ (b) pathology signals with normalized minimum and maximum values shown in red and blue, respectively in the cases with RELN-COLBOS and APOECh. The case with APOECh showed distinct decreased pTau pathological profiles in all cortices compared to the case with RELN-COLBOS. Despite some distribution differences, the Aβ pathology profile was similarly severe in both cases. AMY, amygdala; CAU, caudate; CNG, cingulate cortex; IPC, inferior parietal cortex; ITC, inferior temporal cortex; MES, mesencephalon; MFC, medial frontal cortex; MTC, middle temporal cortex; OL, occipital lobe; PUT, putamen; STC, superior temporal cortex; THA, thalamus. Scale bars, 250 μm.

