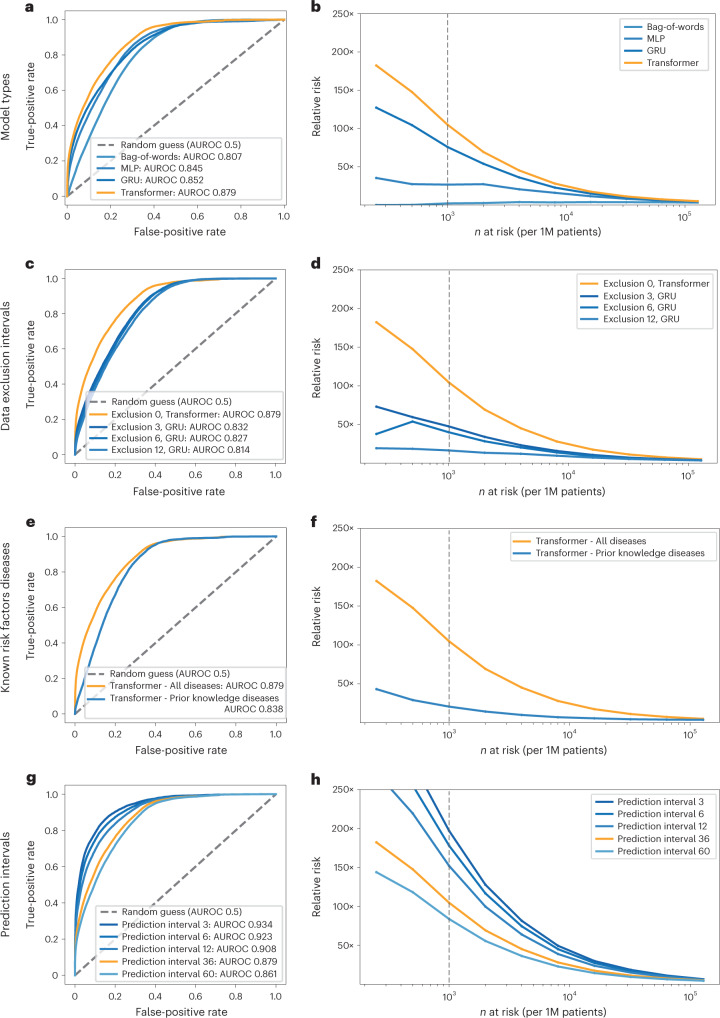
Fig. 3. Performance of the ML model on clinical record trajectories in predicting pancreatic cancer occurrence in the Danish dataset.
For each model and prediction evaluation, performance is better for larger AUROC (a,c,e,g) and for higher RR (Relative risk) for the n (horizontal axis) highest-risk patients (b,d,f,h). a,b, Choice of algorithm: The Transformer algorithm is best with AUROC = 0.879 (no data exclusion, 36-month prediction interval). c,d, Choice of input data: Prediction performance declines with exclusion interval, in training, of k = 3, 6 and 12 months of data between the end of a disease trajectory and cancer occurrence (best model for each exclusion interval, for 36-month prediction interval). e,f, Choice of input data: Prediction is better for all 2,000 ICD level-3 disease codes used throughout in training (Methods) compared to only the subset of 23 known risk factors, using a Transformer, all data (Exclusion 0), for the 36-month prediction interval. g,h, Choice of prediction task: Prediction of cancer is more difficult for larger prediction intervals, the time interval within which cancer is predicted to occur after assessment (Transformer model, all data). We reported prediction performance for the 36-month prediction interval (orange in g and h) in the above panels (a-f), as this is a reasonable choice for design of a surveillance program in clinical practice. b,d,f,h, Prediction performance at a particular operational point—for example (d), for n = 1,000 highest-risk patients (vertical dotted line) out of 1 million (1M) patients, the RR is 104.7 for the 36-month prediction interval using all data and 47.6 with 3-month data exclusion.

