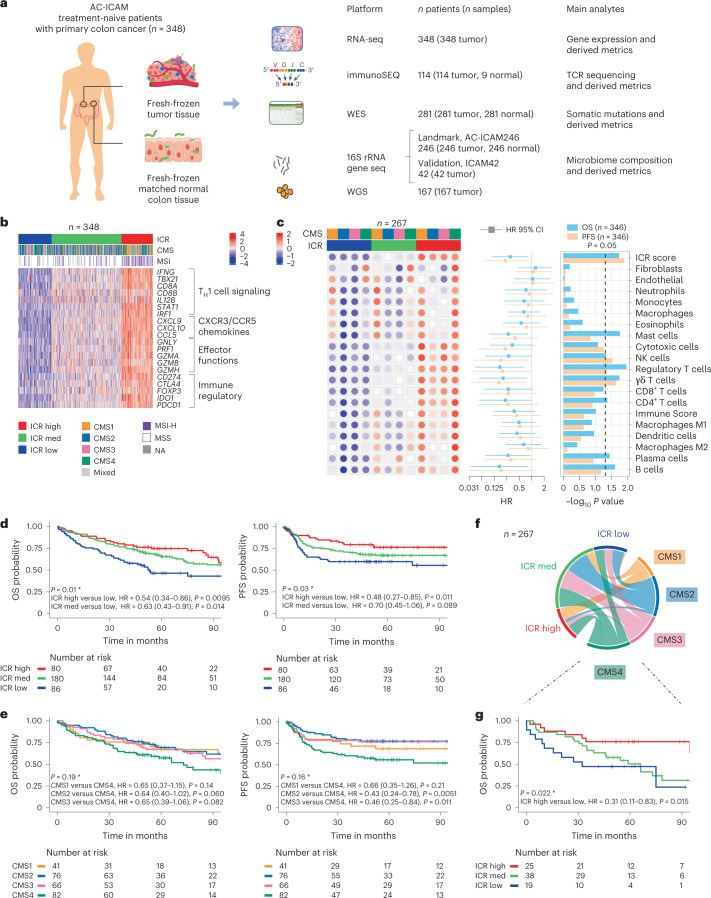
Fig. 1. AC-ICAM study design, immune-related gene signatures, immune and molecular subtypes and survival.
a, Samples from a total of 348 patients with colon cancer were included in AC-ICAM. Number of profiled samples and resulting analytes are indicated for each platform, including RNA-seq, WES, TCR sequencing (immunoSEQ TCRβ assay), 16S rRNA gene sequencing and metagenomic analysis from whole-genome sequencing (WGS) to profile microbiome composition. An additional 42 tumor samples were profiled with 16S rRNA gene sequencing that did not have any matched normal tissue available (ICAM42). b, Heat map of 20 ICR genes (normalized, log2-transformed expression values, z scored by row). Columns represent samples (n = 348) annotated with ICR cluster, CMS and MSI status. NA, not available. c, Deconvoluted abundancies of distinct infiltrating cell populations by ConsensusTME and their association with OS and PFS. Median enrichment scores (z scored by row) within each CMS, stratified by ICR cluster are indicated in the dotted heat map (left). HR (center) and corresponding 95% confidence intervals (error bars) as calculated by Cox proportional hazard regression are displayed as a forest plot (middle) (n = 346 independent samples from 346 patients). P values for the associated HRs are indicated in the bar chart (−log10 P value, right). d, Kaplan–Meier survival curves of ICR clusters for OS (left) and PFS (right). e, Kaplan–Meier survival curves of CMS for OS (left) and PFS (right). f, Circos plot of the relations between ICR and CMS classification. Size of each element is proportional to number of samples in each respective category. g, OS Kaplan–Meier curve of ICR clusters within the CMS4 subtype. (d,e,g) HRs and 95% confidence intervals are calculated by Cox proportional hazard regression. *Overall P value is calculated by log-rank test. Vertical lines indicate censor points. P values are two-sided.

