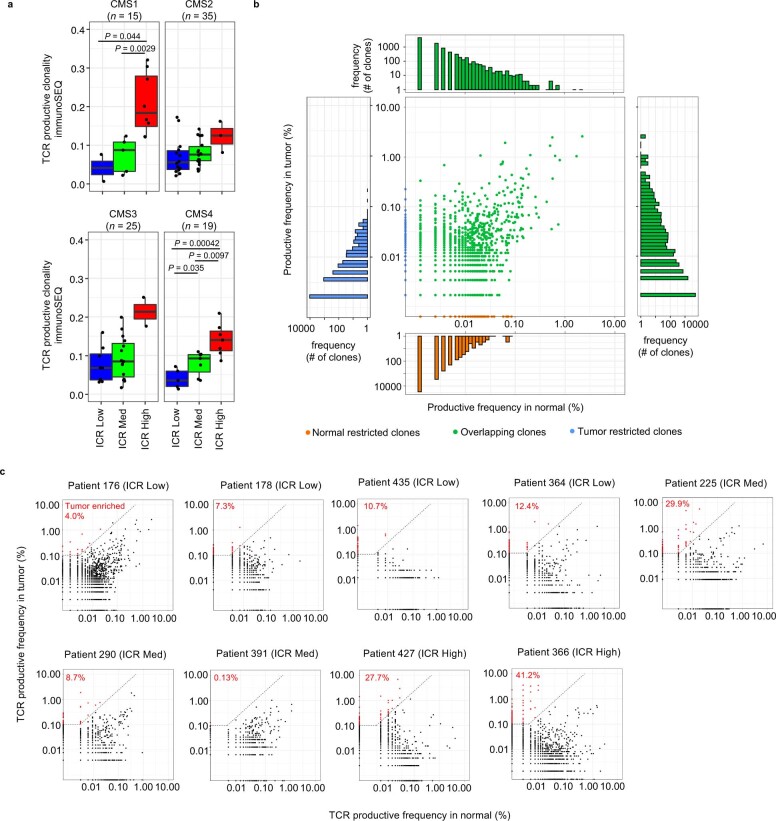
Extended Data Fig. 4. TCR productive clonality by CMS and comparison of clonotypes in paired tumor and normal colon tissue.
a, Box-plot of TCR clonality for each ICR, stratified by CMS. P values are calculated using unpaired, two-sided t-test. Center line, box limits and whiskers represent the median, interquartile range and 1.5x interquartile range respectively. n reflects independent number of samples. b, Example of a plot showing productive TCR frequencies in normal tissue (x-axis) and corresponding frequency in tumor tissue (y-axis). Blue indicates T cell clones that are restricted to the tumor, while T cell clones that are unique to normal colon tissue are orange. Represented in green are T cell clones found both in tumor and normal colon tissue. The side panels represent a cumulative histogram of the TCR productive frequencies across that axis. c, Productive TCR scatter-plots of all nine patients for which TCR sequencing was performed on both tumor and matched normal colon samples. T cell clones in the upper left region (red) are considered significantly enriched in the tumor. Tumor-enriched clones were defined as T cell clones with an abundance of >0.1% in the tumor, that are at least 32 times more abundant in the tumor compared to the normal.

