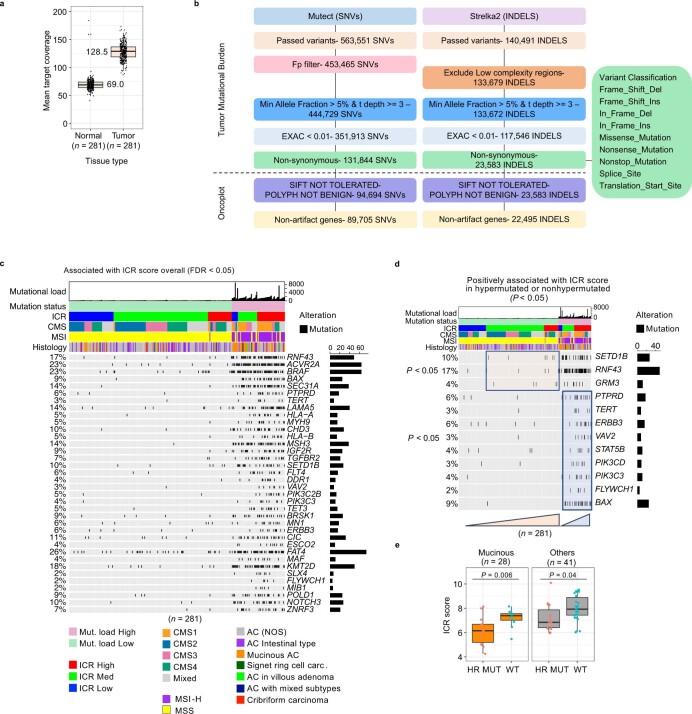
Extended Data Fig. 5. Mutation calling and associations between ICR and somatic alterations.
a, The mean target coverage in tumor and normal colon tissue. Center line, box limits and whiskers represent the median, interquartile range and 1.5x interquartile range respectively. b, Visual representation of the mutect-strelka2 based mutation calling pipeline, indicating at each step the remaining SNV and INDELS in the AC-ICAM cohort. c, Oncoprint of genes with the highest correlation with ICR score according to fitting of a binomial linear regression model using all samples as input. d, Oncoprint of genes with the highest correlation with ICR score according to fitting of binomial linear regression models using either hypermutated or non-hypermutated samples. All genes with P value < 0.05 as predictor variable in the regression model are displayed (c, d). e, Box-plot of ICR score in samples with a mutation in any HR repair gene (BRCA1, BRCA2, FANCA) versus those without mutation or wild-type (WT), stratified by tumor histology (mucinous versus all other histologies) in hypermutated samples. P value is calculated using unpaired, t-test. Center line, box limits, and whiskers represent the median, interquartile range and 1.5x interquartile range respectively. All P values are two-sided; n reflects the independent number of samples in all panels.

