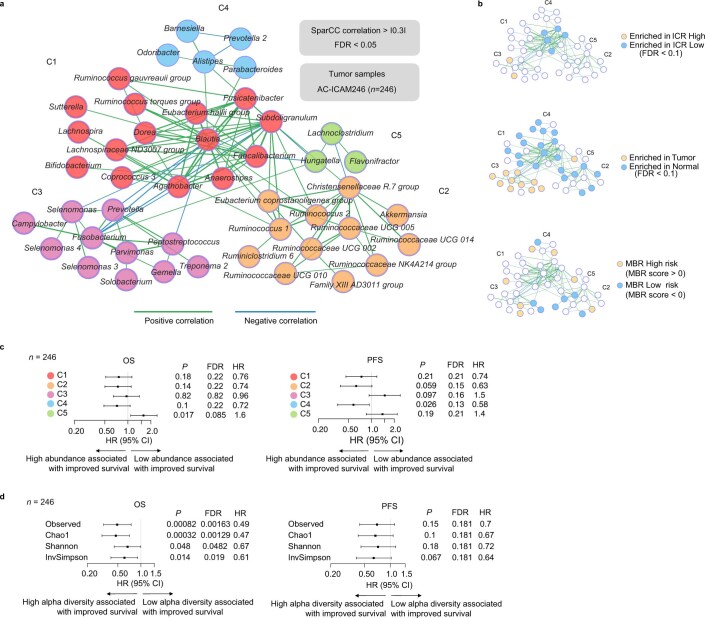
Extended Data Fig. 9. Co-occurrence network of microbial taxa and associations of identified clusters with biological and clinical parameters.
a, SparCC co-occurrence network using centered log-ratio transformed OTUs in the AC-ICAM246 tumor samples. b, Overlay of network taxa with taxa enriched in ICR High or Low group (left panel), with taxa enriched in tumor vs normal colon samples (middle panel), and when present in the MBR classifier, either as low or high risk (right panel). c, Association between OS and PFS and the sum of the relative abundance of each genus (High vs low based on median) in each cluster in AC-ICAM246. d, Association between OS and PFS and distinct alpha diversity metrics (High vs low based on median) of the tumor microbiome in AC-ICAM246. HR (center), corresponding 95% confidence intervals (error bars) and corresponding P values are calculated by cox proportional hazard regression (c-d). All P values are two-sided; n reflects the independent number of samples in all panels. Overall Survival (OS). Progression-Free Survival (PFS).

