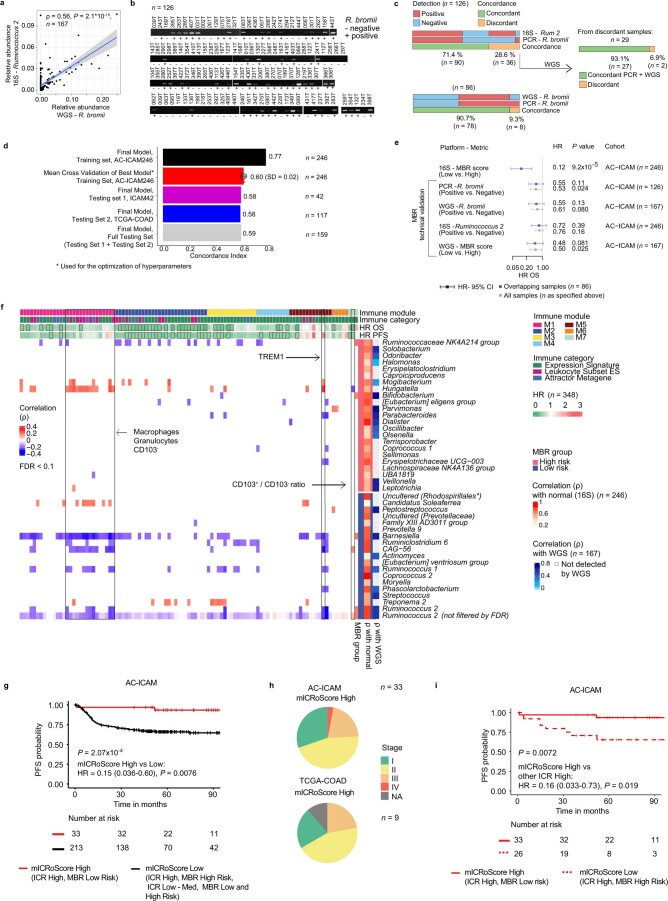
Extended Data Fig. 10. Technical validation of microbiome data, MBR and mICRoScore assessment, and correlation of MBR taxa with immune traits.
a, 16 S rRNA gene sequencing versus WGS relative abundance of Ruminococcus 2. Spearman correlation and P value are indicated. The gray band reflects the 95% confidence interval for predictions of the linear regression model between the plotted variables. b, PCR gel images of 126 DNA samples amplified for R. bromii. c, Concordance between R. bromii PCR and detection of Ruminococcus 2 by 16 S rRNA gene sequencing or of R. bromii by WGS (positivity was defined as a relative abundance > 0). d, Concordance index of optimal multivariate cox regression model per dataset. The cross-validation performance highlights the mean concordance of 10-different folds with the optimal hyper parameters (gamma and lambda) that is, the same parameters as the optimal model. e, Forest plot with HR (center), corresponding 95% confidence intervals (error bars), and P value calculated by cox proportional hazard regression analysis for OS, using: 1) the 16 S MBR score in AC-ICAM, 2) WGS R. bromii abundance 3) PCR-based R. bromii abundance, 4) 16 S Ruminococcus 2 relative abundance and 5) MBR score calculated using WGS data. f, Heat map of Spearman correlation between the relative abundance of the MBR classifier taxa in tumor samples and immune traits. Only correlations with an FDR > 0.1 are visualized. An additional row is added for Ruminococcus 2 showing all correlations, unfiltered for FDR. * The taxonomical order is indicated between brackets, as family was unassigned. g, Kaplan–Meier curve for PFS in AC-ICAM, with all patients stratified by mICRoScore High vs Low. HR and P value are calculated using cox proportional regression. h, AJCC pathological stage within the mICRoScore High group in AC-ICAM and within TCGA-COAD i, Kaplan–Meier curve for PFS in AC-ICAM, with all patients with ICR High stratified by mICRoScore. Overall P value is calculated by log-rank test and P value corresponding to HR is calculated using cox proportional hazard regression. Overall Survival (OS), Progression-Free Survival (PFS). All P values are two-sided; n reflects the independent number of samples in all panels.

