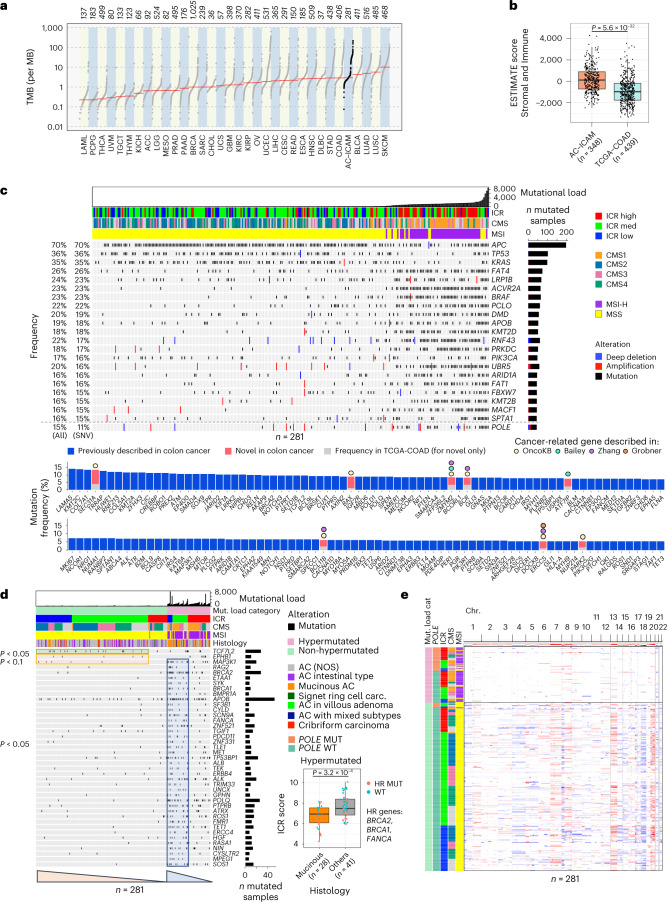
Fig. 3. Detection of somatic alterations and association with tumor immune subtypes.
a, TMB in the AC-ICAM cohort and all TCGA cohorts. b, ESTIMATE scores in AC-ICAM and TCGA-COAD cohorts. Unpaired two-sided Student’s t-test. c, Oncoprint of cancer-related genes that are most frequently somatically altered. Samples are ordered by nonsynonymous mutational load. Frequency of mutated samples as percentage of the total number of samples is shown on the left side of the plot, including the percentage of all somatic alterations, including deep deletions, amplifications and single-nucleotide variants (SNVs) and for only SNVs. Genes are ordered by frequency of SNVs. Genes with an SNV frequency ≥15% are included in the oncoprint, whereas genes with a frequency between 5–15% are included in the bar chart below. POLE is included below the dotted gray line in the oncoprint to visualize the POLE mutation in relation to MSI status. d, Oncoprint of genes with somatic mutations that are associated with low ICR score as determined by fitting of binomial linear regression models. Binomial linear models were generated for non-hypermutated and hypermutated subgroups separately. All genes with P value < 0.05 as predictor variable in the regression model are displayed. Orange triangle marks genes that were associated with lower ICR score in non-hypermutated samples, whereas the blue triangle highlights genes associated with low ICR in hypermutated samples. Significance of the association is indicated on the left of the plot. Box-plot of ICR score by tumor histology (mucinous versus all other histological classifications) in hypermutated samples, mutated in either of the homologous recombination (HR) repair genes (BRCA1, BRCA2 and FANCA) are indicated by the color of the dots. P value is calculated using unpaired, two-sided Student’s t-test. AC, adenocarcinoma; NOS, not otherwise specified; MUT, mutant; WT, wild-type. e, Heat map of copy-number changes of the 22 autosomes, with red indicating gains and blue indicating losses. Samples are sorted by mutational load category, POLE mutation status, ICR, CMS and MSI, consecutively. All P values are two-sided; n reflects the independent number of samples. For all box-plots, center line, box limits and whiskers represent the median, interquartile range and 1.5× interquartile range, respectively.

