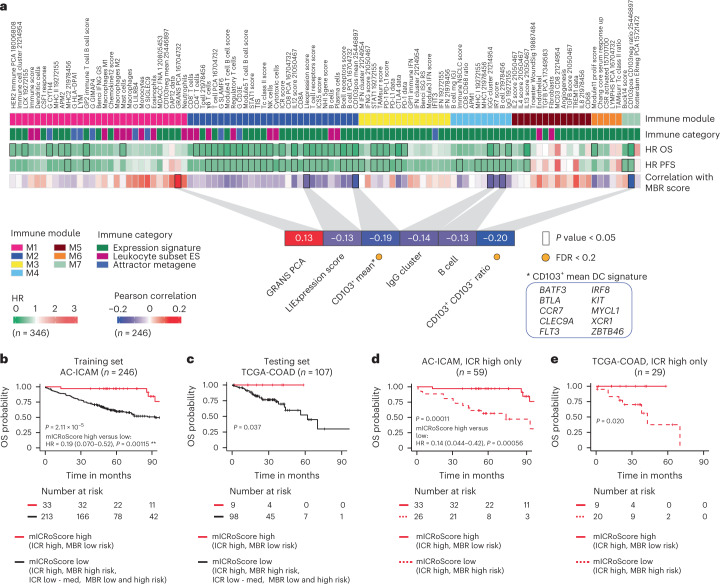
Fig. 6. Correlation between MBR score and immune traits and development and validation of the mICRoScore.
a, Visual representation of the associations between immune modules, immune categories, OS, PFS and the Pearson correlation between the MBR score and the immune traits. Inset highlights the significant Pearson correlations (P < 0.05), associations with FDR < 0.2 are indicated with a yellow dot. IFN, interferon; ES, enrichment score. b,c, Kaplan–Meier curves of OS by mICRoScore in AC-ICAM (b) and TCGA-COAD (c). d,e, Kaplan–Meier curve of OS in ICR-high samples by mICRoScore in AC-ICAM (d) and TCGA-COAD (e). Overall P value is calculated by log-rank test. Vertical lines indicate censor points. HRs and 95% confidence intervals are calculated by Cox proportional hazard regression. All P values are two-sided; n reflects the independent number of samples.

