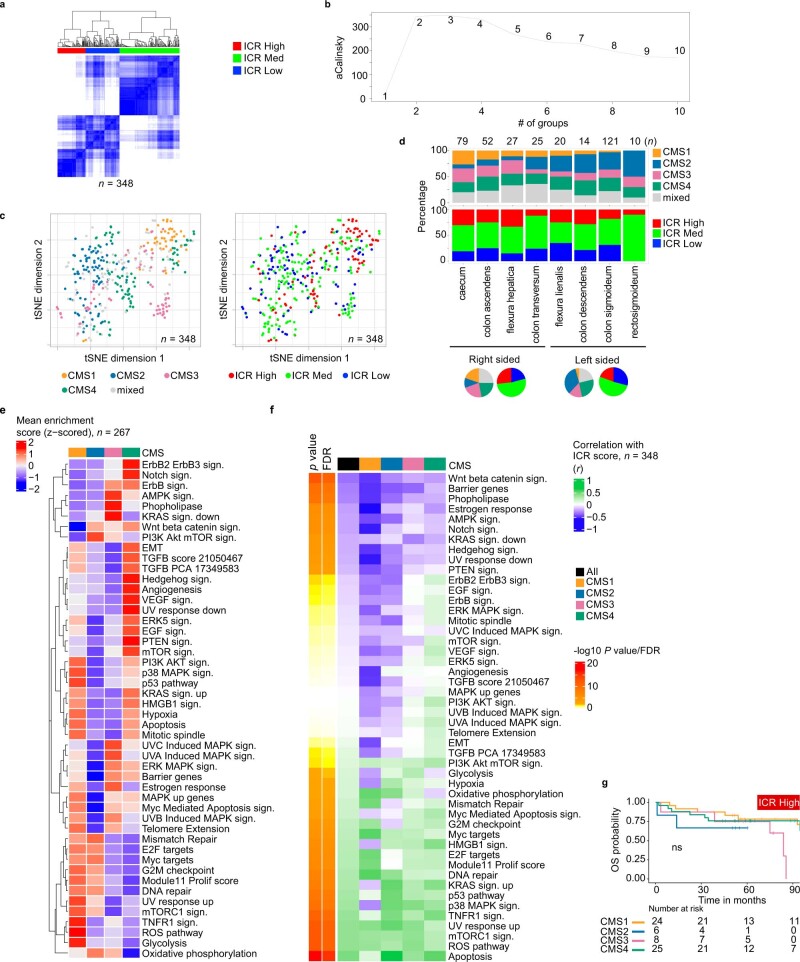
Extended Data Fig. 2. ICR clustering and oncogenic pathways.
a, Visual representation of consensus clustering with a heat map of the 20 ICR genes, using 5000 repeats, agglomerative hierarchical clustering with ward criterion inner and complete outer linkage. b, The optimal number of clusters allowing for the best segregation of samples based on the Calinski-Harabasz criterion. c, First and second dimension from t-distributed stochastic neighbor embedding (t-SNE) dimension-reduction algorithm applied to whole-transcriptome data of colon tumor samples (n = 348) colored by CMS (left) and ICR cluster (right). d, Stacked bar chart showing proportion of CMS by anatomic location of the tumor. Pie charts reflect proportions within right sided (ceceum until colon transversum) and left sided tumors (flexura lienalis until rectosigmoideum). e, Mean Singe Sample Gene Set Enrichment Analysis (ssGSEA) score for oncogenic pathways by each CMS. f, Pearson correlation (two-sided) of oncogenic pathways with ICR score; EMT: epithelial to mesenchymal transition. g, Kaplan–Meier curves for Overall Survival (OS) of CMS subtypes within ICR High. Overall P value is calculated by log-rank test. All P values are two-sided; n reflects the independent number of samples in all panels.

