Figure 7.
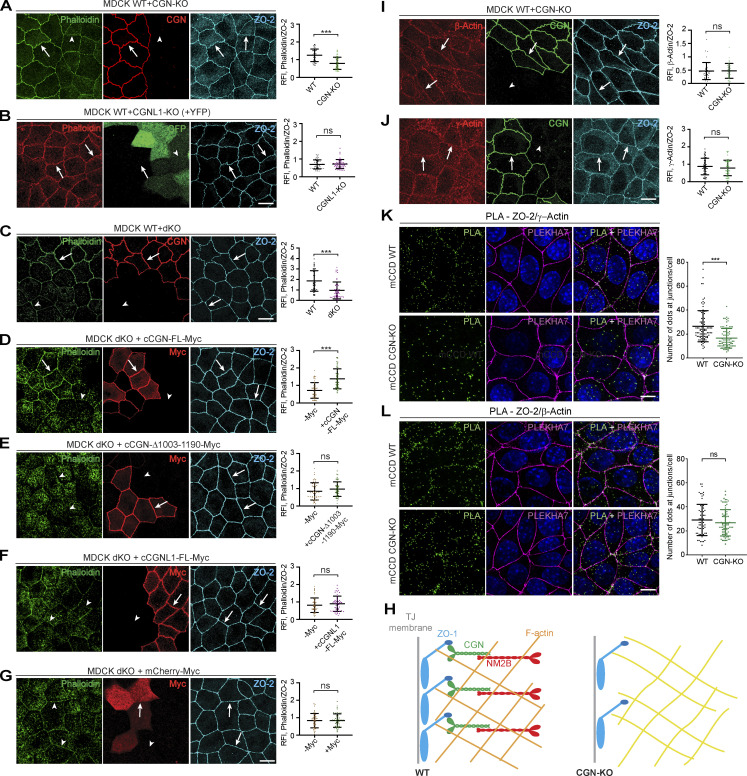
CGN binding to NM2B promotes junctional phalloidin labeling and CGN is required for TJ proximity of γ-actin. (A–G) IF microscopy localization of phalloidin (green channel, except for red in panel B), endogenous CGN (red, A and C), GFP (to identify CGNL1-KO cells, green in B), exogenously expressed myc-tagged rescue constructs (red, D–G) and ZO-2 used as a junctional reference marker (A–G, magenta) in either mixed cultures of CGN-KO and WT (A), CGNL1-KO and WT (B), double-KO (dKO) and WT (C) and rescued double-KO (D–G) MDCK cells. Double-KO cells were rescued with either myc-tagged FL CGN (D), or C-terminally truncated (CGN-Δ1003-1190) CGN (E), or myc-tagged FL CGNL1 (F), or mCherry-myc (negative control; G). Quantifications of relative fluorescent intensity (RFI) on the right of IF panels show the ratio between the junctional staining of phalloidin versus ZO-2. Data are represented as mean ± SD (n = 48 from two independent experiments). (H) Simplified scheme of the effect of CGN-KO on phalloidin labeling and ZO-1 junctional accumulation. Orange and yellow colors of schematic actin filaments indicate stronger and weaker phalloidin labeling, respectively. The filaments are shown as a branched network (Heuzé et al., 2019), either under tension (WT, orange) or relaxed (yellow, KO; see Discussion). ZO-1 accumulation at TJ is reduced in CGN-KO cells (scheme). (I and J) IF microscopy analysis and quantification of β-actin (I) and γ-actin (J) in mixed cultures of WT and CGN-KO MDCK cells. Arrows indicate junctional labeling, arrowheads indicate junctions between CGN-KO cells (β-actin n = 42 and γ-actin n = 48 from two independent experiments). (K–L) In situ PLA (green) to detect proximity between endogenous γ-actin (K) or β-actin (L) and ZO-2 in either mCCD WT or CGN-KO cells labeled with anti-PLEKHA7 (magenta) as a junctional reference marker. Nuclei are stained in blue. PLA dots quantification on the right side of the panel (K: n = 90 for WT cells and n = 83 for CGN-KO cells; L: n = 70 for WT cells and n = 73 for CGN-KO cells, from two independent experiments). Data are represented as mean ± SD. Statistical significance (A–G and I–L) was determined by unpaired Mann–Whitney’s test, ***P ≤ 0.001. Scale bars = 10 μm.

