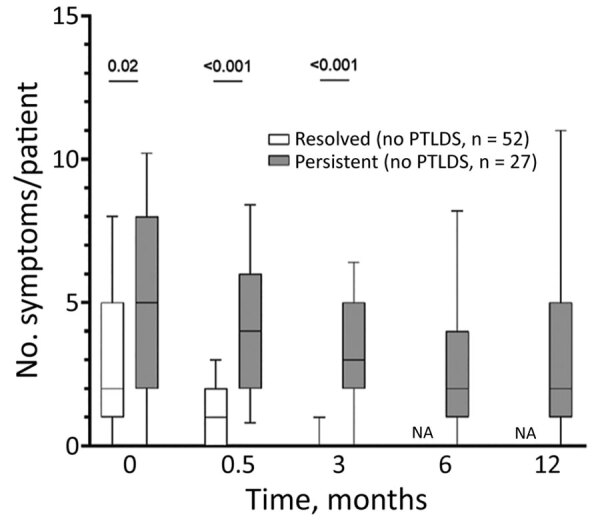
Figure 1.

Individual frequency of each symptom at each follow-up timepoint in study of association of persistent symptoms after Lyme neuroborreliosis and increased levels of interferon-α in blood among patients in Slovenia. Data in patients whose symptoms resolved are shown in the left graph and in those with persistent symptoms in the right graph. Red stars indicate symptoms that occurred at significantly higher frequency in the persistent group compared with the resolved group. p values were calculated using nonparametric Mann-Whitney rank sum tests; p<0.05 was considered statistically significant. T, timepoint (0 indicates baseline).
