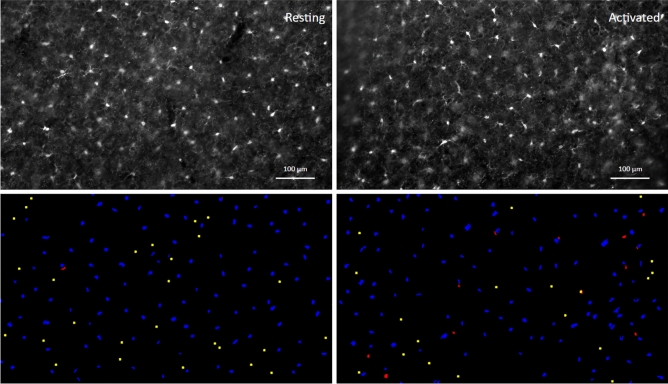
Figure 2.
Images of immunofluorescence-labeled microglia before and after segmentation. An example of processed paired images of Iba-1 immunolabeled microglia in cerebral cortex (layer III; Upper panel) of wild-type, non-transgenic (‘Resting’) and of HIVgp120tg mice (‘Activated’), and the accompanying final segmentation images generated via ACCT (lower panel). Resulting object segmentations are color-coded (blue = true positive, red = false positive, yellow = false negative). Segmented objects from images in the same field of view were projected with a size exclusion minimum of 50 pixels for counting. Immunofluorescence staining and acquisition of images are described in previous publications and the Methods Section17. Scale bar: 100 .

