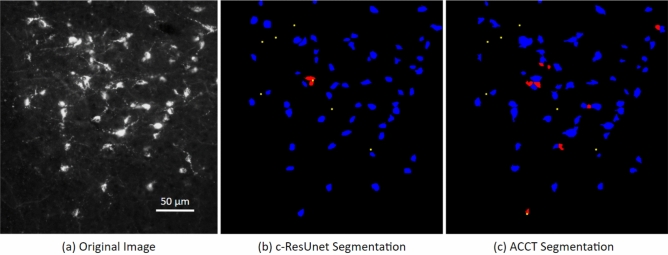
Figure 3.
Image of fluorescence-labeled neurons before and after segmentation. A cropped image taken from the Fluocell dataset paired with cell segmentation (a). This depicts segmented cell objects from image reported in the publicly available Fluocell dataset segmented by c-ResUnet10 (b) and ACCT with classifierBayes3 (c). Resulting object segmentations are color-coded (blue = true positive, red = false positive, yellow = false negative). ACCT was set to filter out objects smaller than 250 pixels and greater than 5000 pixels to remove noise. We applied the watershed algorithm to this dataset. ACCT correctly identified 84.6% of the hand counts in this image and c-ResUnet 86.2%, while ACCT was correct with 86.9% of all predictions and c-ResUnet with 93.3%. Scale bar: 50 .

