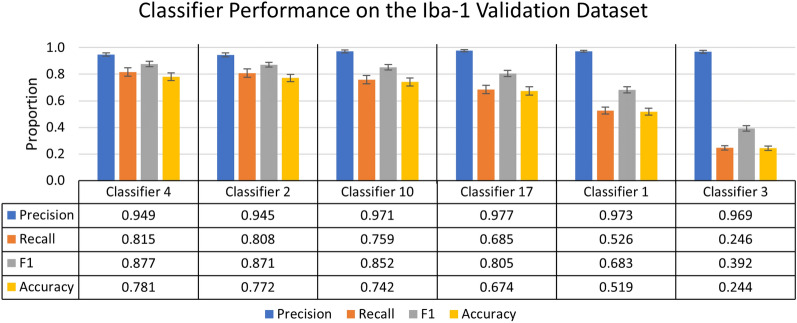
Figure 4.
Summary of individual classifier performance on the Iba-1 microglia dataset during the validation stage. A chart of the most and least accurate three incrementally trained classifiers, ranked by F1 score of 25 trained classifiers (n = 10 images). Error bars represent standard error of the mean on calculated performance statistics from each image, where the statistic itself is calculated from total cells in the dataset. The parameters used in ACCT: 0.5 threshold, 50 minimum pixel size, and 1,000 maximum pixel size.

